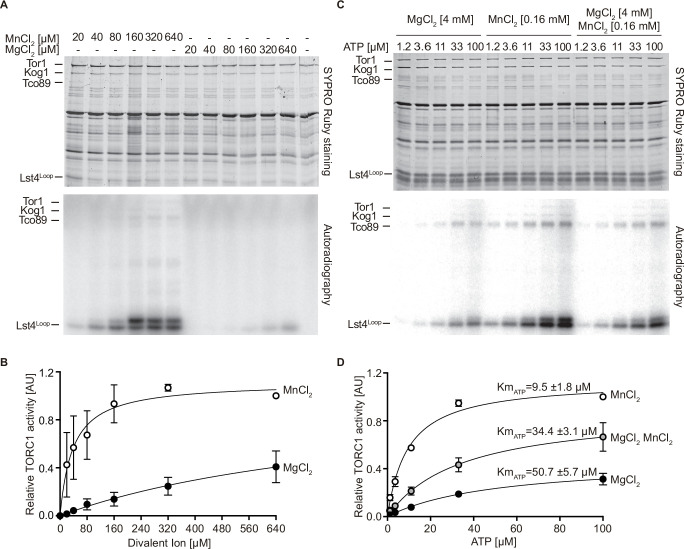
Figure 3. MnCl2 stimulates TORC1 kinase activity in vitro and in vivo.
(A) In vitro TORC1 kinase assays using [γ-32P]-ATP, recombinant Lst4Loop as substrate, and increasing concentrations (twofold dilutions) of MgCl2 or MnCl2. Substrate phosphorylation was detected by autoradiography (lower blot) and SYPRO Ruby staining is shown as loading control (upper blot). (B) Quantification of the assay shown in (A). Curve fitting and parameter calculations were performed with GraphPad Prism. Data shown are means (± SEM, n=3). (C) In vitro kinase assays (as in A) using the indicated concentrations of MgCl2 and/or MnCl2 and increasing concentrations of ATP. Substrate phosphorylation was detected by autoradiography (lower blot) and SYPRO Ruby staining is shown as loading control (upper blot). (D) Quantification of the assay shown in (C). Data shown are means (± SEM, n=3). Curve fitting and parameter calculations were performed with GraphPad Prism. KmATP are shown for each curve. VMAX [MnCl2]=1.13 ± 0.06, VMAX [MgCl2 MnCl2]=0.89 ± 0.03, VMAX [MgCl2]=0.47 ± 0.02.

