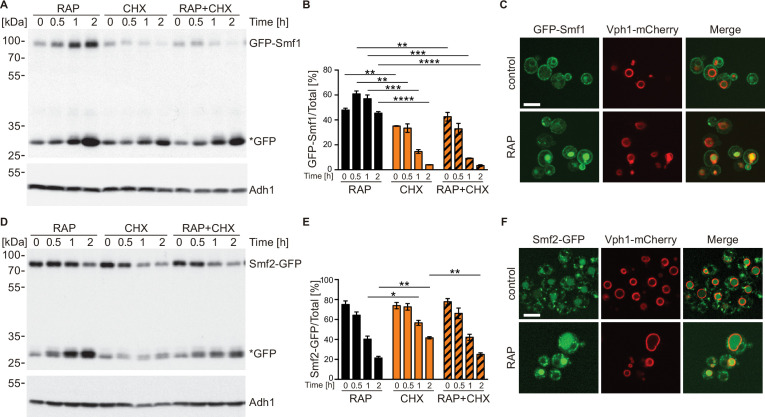
Figure 4. TORC1 regulates natural resistance-associated macrophage protein (NRAMP) transporter levels.
(A) GFP-Smf1 expressing cells were cultivated for 5–6 hr in a synthetic medium devoid of manganese sulfate before being treated with 200 ng/ml rapamycin (RAP), 25 µg/ml cycloheximide (CHX), or both compounds (RAP + CHX) for the indicated times. GFP-Smf1 and cleaved GFP (*GFP) protein levels were analyzed by immunoblotting using an anti-GFP antibody. Alcohol dehydrogenase (Adh1) protein levels, probed with anti-Adh1 antibodies, served as a loading control. (B) Quantification of GFP-Smf1. Percentages of GFP-Smf1 relative to the total GFP signal (GFP-Smf1 + GFP) are plotted. Data represent means ± SEM of independent experiments (n=3). Statistical analysis: unpaired two-tailed t-test. *p<0.05; **p<0.01, ***p<0.001, ****p<0.0001. (C) Microscopic analysis of GFP-Smf1 localization. Cells co-expressing GFP-Smf1 and the vacuolar marker Vph1-mCherry were grown exponentially in a manganese-free medium for 5–6 hr, then treated with 200 ng/ml rapamycin for 2 hr. Scale bar represents 5 µm. (D–E) Cells expressing Smf2-GFP from its endogenous locus were grown, treated, and processed as in (A). (F) Microscopic analysis of Smf2-GFP localization. Cells co-expressing Smf2-GFP and the vacuolar marker Vph1-mCherry were cultivated, treated, and examined as in (C).

