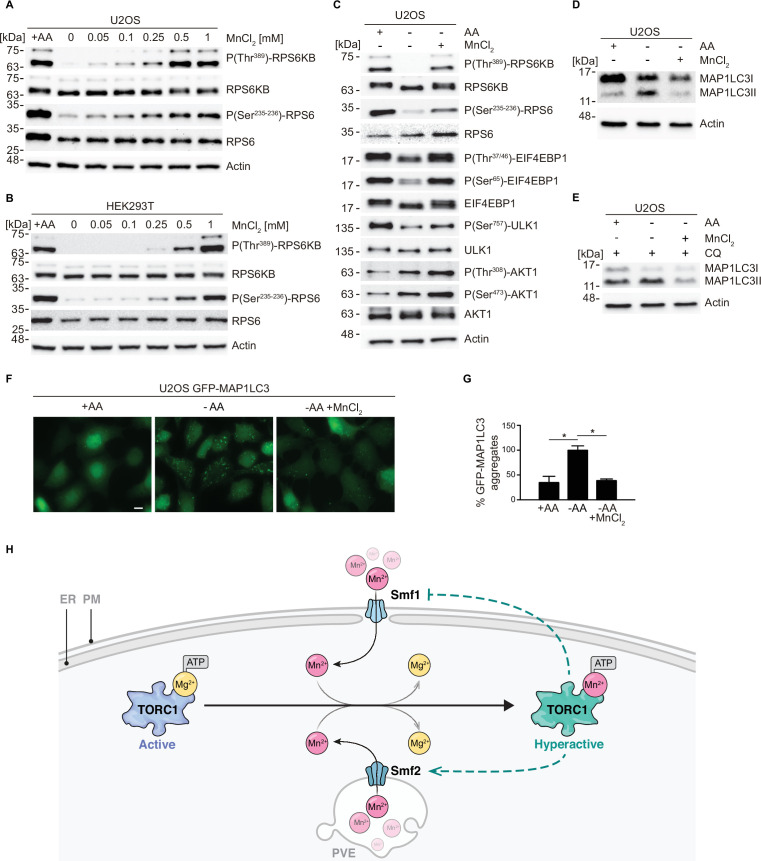
Figure 5. MnCl2 maintains mTORC1 activity during starvation in human cells.
(A–B) Human U2OS (A) and HEK293T (B) cells were starved for all amino acids and supplemented with increasing concentrations of MnCl2 as indicated for 2 hr. Phosphorylation of the mTORC1 downstream targets RPS6KB (ribosomal protein S6 kinase B) and RPS6 (ribosomal protein S6) was assessed by immunoblot analysis. A control with cells incubated in the presence of all proteinogenic amino acids (+AA) was included as a positive control. (C) Human U2OS were starved for all amino acids (-AA) and supplemented with 0.35 mM of MnCl2 for 2 hr. Phosphorylation of RPS6KB, RPS6, EIF4EBP1, ULK1, and AKT1 was assessed by immunoblot analysis. A control with cells incubated in the presence of all proteinogenic amino acids (+AA) was included as a positive control. (D–E) Human U2OS cells were treated as in (C) for 4 hr either in the absence (D) or the presence (E) of chloroquine (CQ). Autophagic marker MAP1LC3I/II was then analyzed by immunoblot. (F–G) GFP-MAP1LC3 expressing U2OS cells were incubated as in (D). GFP-MAP1LC3 aggregation was assessed by confocal microscopy (F) and quantified using ImageJ software (G). Scale bar indicates 10 µm. Values were normalized to -AA condition. Graphs represent mean ± SD, with n=3 (*p<0.05, ANOVA followed by Tukey’s test). (H) Model of Mn2+-driven TORC1 activation. The Smf1/2 natural resistance-associated macrophage protein (NRAMP) transporter-dependent increase in cytoplasmatic Mn2+ levels favors TORC1-Mn2+ binding and ATP coordination, leading to TORC1 hyperactivation. NRAMP transporters are part of a feedback control mechanism impinged by TPRC1 (dashed lines).

