. 2022 Jul 29;11:e77913. doi: 10.7554/eLife.77913

Figure 2. Correlations of growth parameters with winter temperature.

(A) Initial size. (B) Growth rate at 16°C. (C) Growth rate at 6°C. (D) Temperature response of growth rate. Colors indicate genetically defined subpopulations of the accessions (1001 Genomes Consortium, 2016).

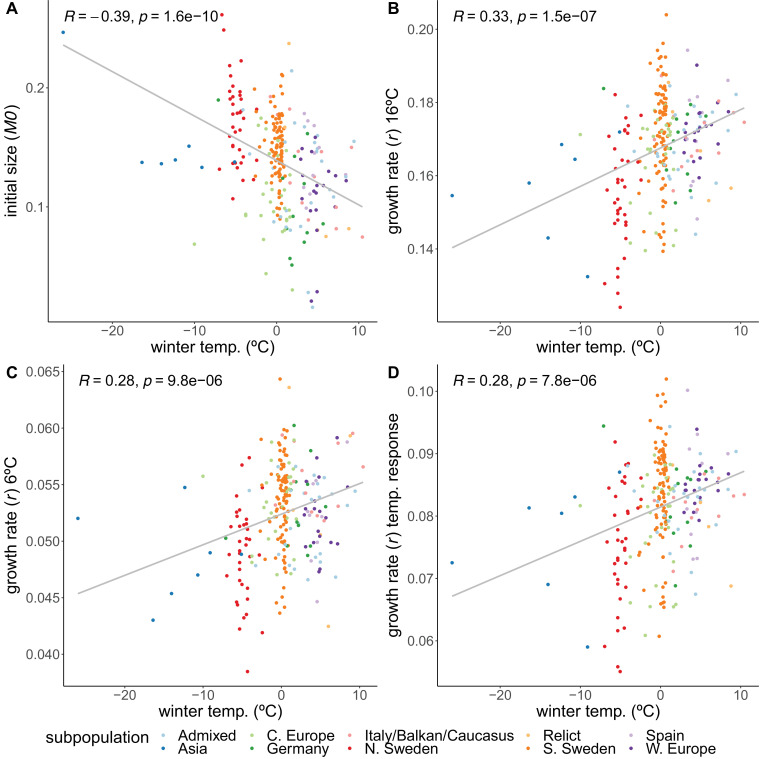
Figure 2.

Figure 2—figure supplement 1. Variation among accessions of initial size (M0), growth rate (r), and the temperature response of the growth rate.

Figure 2—figure supplement 1.

Distributions of initial size (A), growth rate (B) and growth rate's temperature response (C).
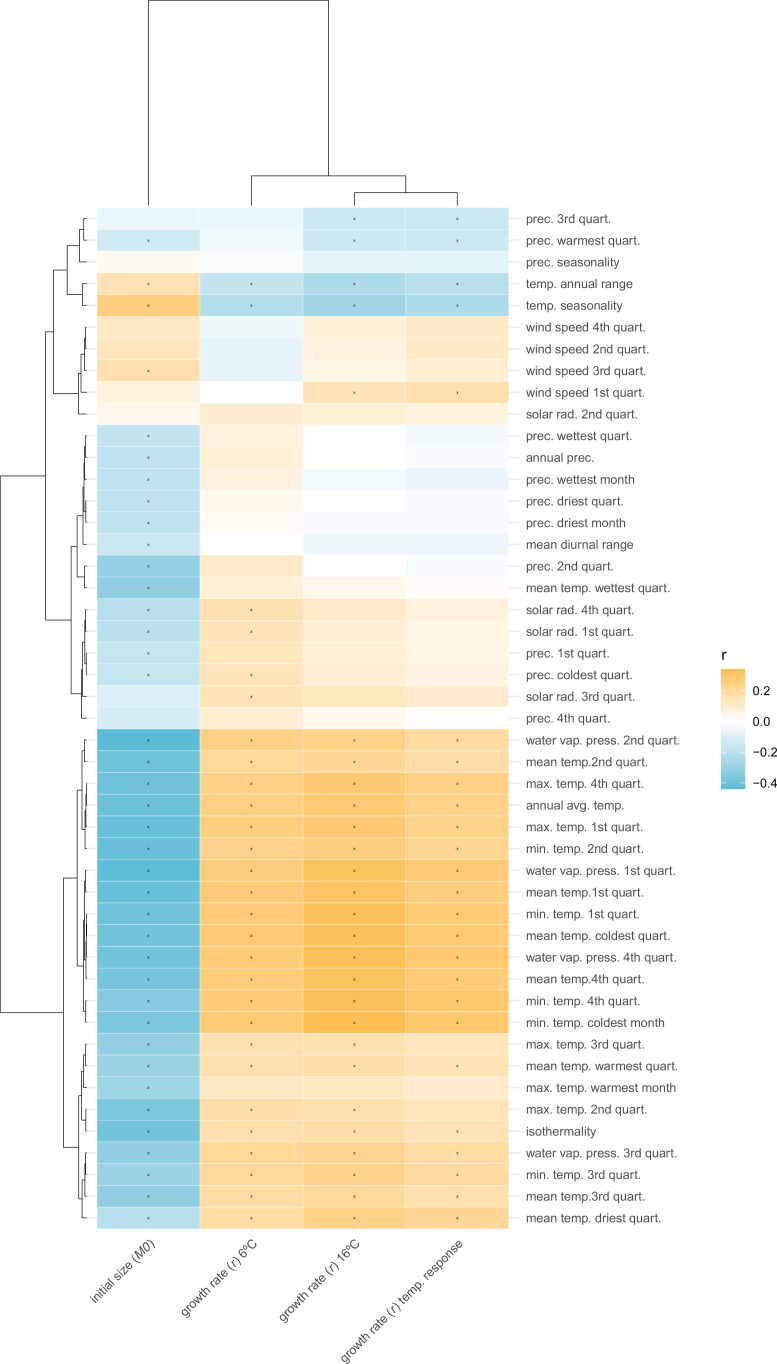
Figure 2—figure supplement 2. Correlations between growth parameters and (bio)climate variables.

Figure 2—figure supplement 2.

(Bio)climate variables taken from the worldclim database (https://www.worldclim.org). Colors are correlation coefficients, correlations with false discovery rate (FDR)-corrected p-values <0.05 are indicated with a star. The order of the climate variables and phenotypes is based on hierarchical clustering.
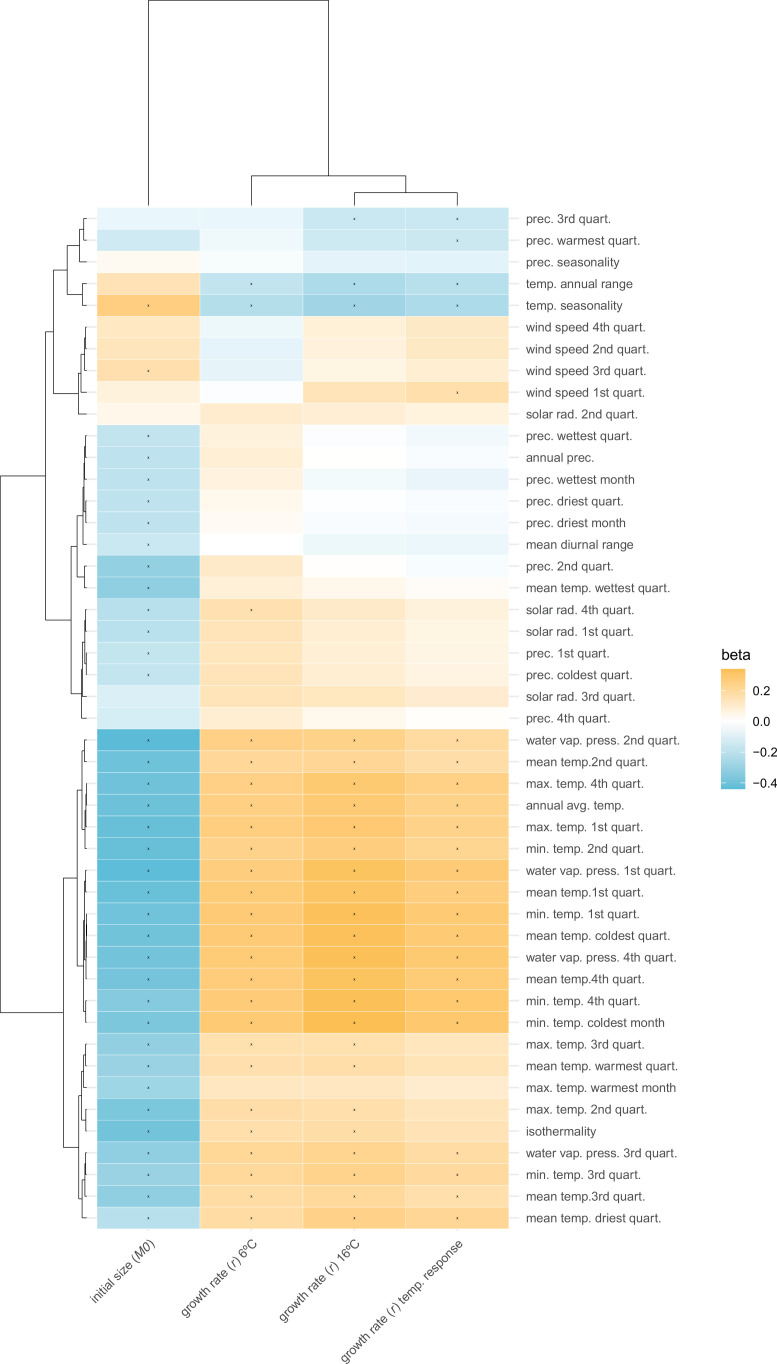
Figure 2—figure supplement 3. Population structure-corrected correlations between growth parameters and (bio)climate variables.

Figure 2—figure supplement 3.

(Bio)climate variables taken from the worldclim database (https://www.worldclim.org). Colors are the coefficients for the climate variable in the mixed model with phenotype as dependent variable and population structure as random factor. Phenotypes and climate variables were standardized, making regression coefficients comparable to correlation coefficients. Correlations with false discovery rate (FDR)-corrected p-values <0.05 are indicated with a star. The order of the climate variables and phenotypes is based on hierarchical clustering.
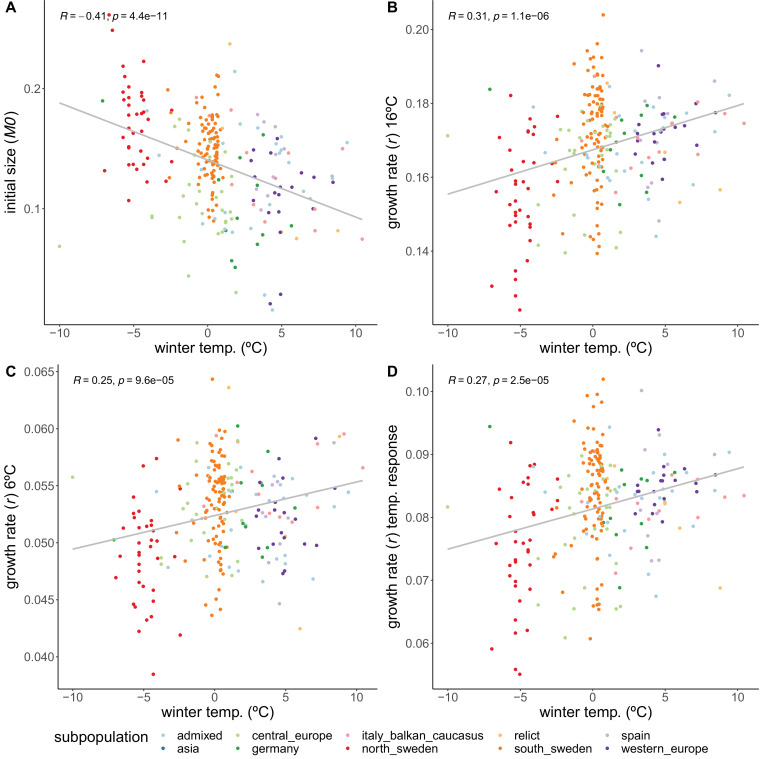
Figure 2—figure supplement 4. Correlations of growth parameters with winter temperature, excluding accessions defined as Asian subpopulation.

Figure 2—figure supplement 4.

(A) Initial size. (B) Growth rate at 16ºC. (C) Growth rate at 6ºC. (D) Temperature response of growth rate. Colors indicate genetically defined subpopulations of the accessions (1001 Genomes Consortium, 2016).
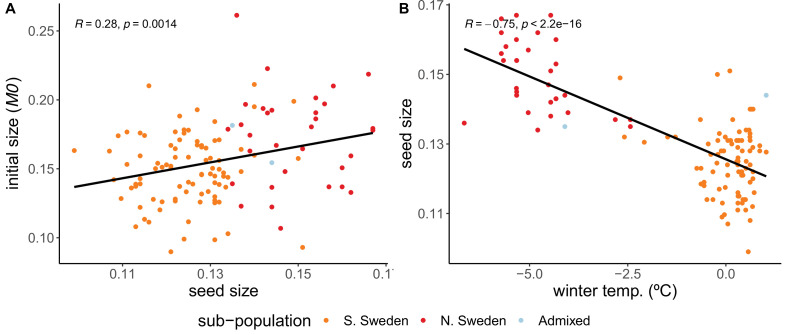
Figure 2—figure supplement 5. Seed size correlations.

Figure 2—figure supplement 5.

(A) Correlation between initial size and seed size. (B) Correlation between seed size and winter temperature. Accessions are a subset of 123 Swedish accessions.
Figure 2—figure supplement 6. Growth rate’s temperature response variation.

Figure 2—figure supplement 6.

(A) Coefficient of variance of the growth rate’s temperature response, for each subpopulation, correlated with each subpopulation’s respective median winter temperature. (B) Correlation between growth rate’s temperature response and winter temperature, excluding all Swedish accessions. (C) Correlation between growth rate’s temperature response and winter temperature, exclusively for Swedish accessions.