. 2022 Jul 29;11:e77913. doi: 10.7554/eLife.77913

Figure 3. Expression of 251 previously described cold-acclimation genes.

Expression is shown as the gene-wide z-scores of the normalized counts. The z-scores allow for grouping genes with a similar expression behavior over the different accessions in both temperatures. The top bar indicates winter temperature (°C) for each accession’s origin. Both dendrograms along y-axis and x-axis, respectively, show hierarchical clustering of genes, and of accessions in both temperatures.

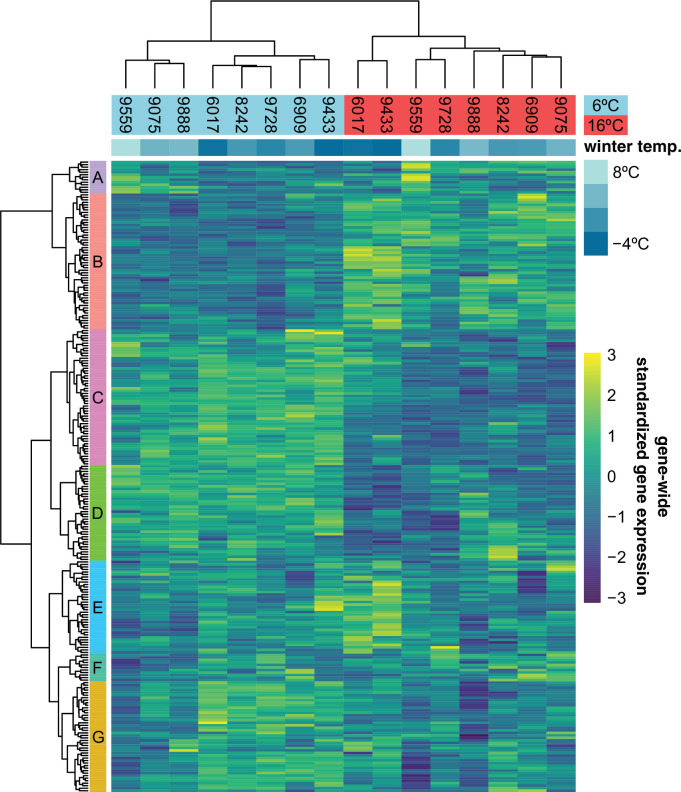
Figure 3—source data 1. Cold-acclimation genes and their expression cluster membership as shown in Figure 3.

Figure 3.

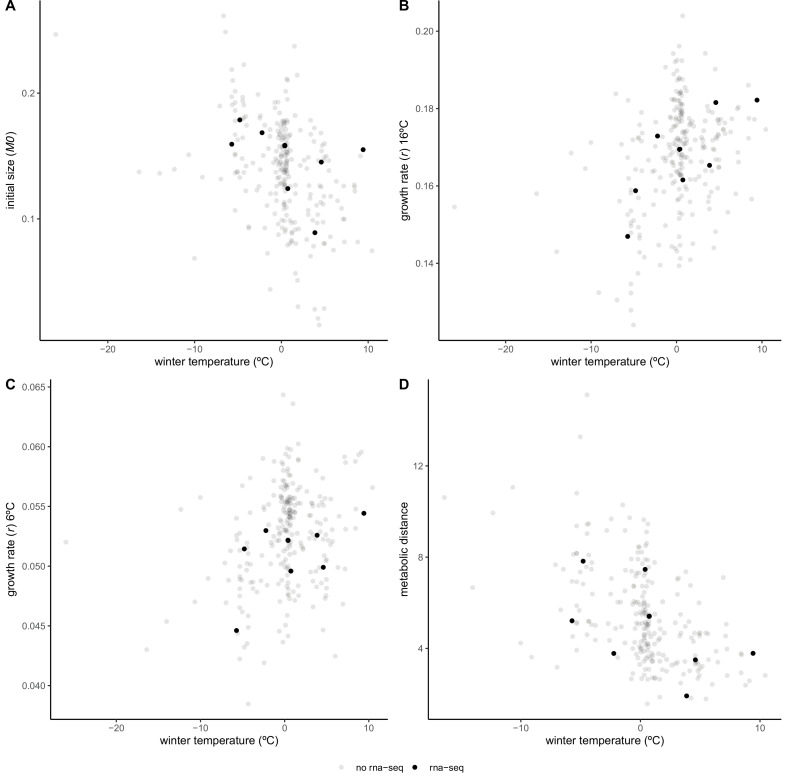
Figure 3—figure supplement 1. Growth parameters and metabolic distance of RNA-sequenced accessions in relation to local mean temperature of coldest quarter.

Figure 3—figure supplement 1.

Initial size (A), growth rate at 16°C (B) and 6°C (C), and metabolic distance (D), as a measure of temperature response over all 37 measured primary metabolites (Weiszmann et al., 2020). Accessions selected for RNA-sequencing are depicted in black, remaining accessions are shown in gray. These eight accessions were chosen to represent the climatic variation in the full panel.
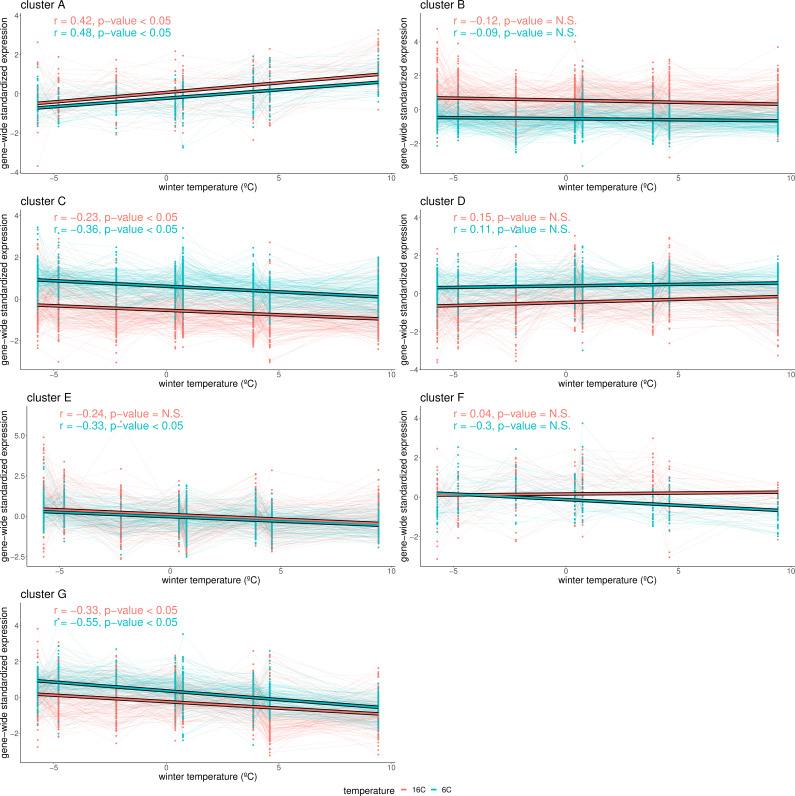
Figure 3—figure supplement 2. Cluster-specific expression in relation to winter temperature.

Figure 3—figure supplement 2.

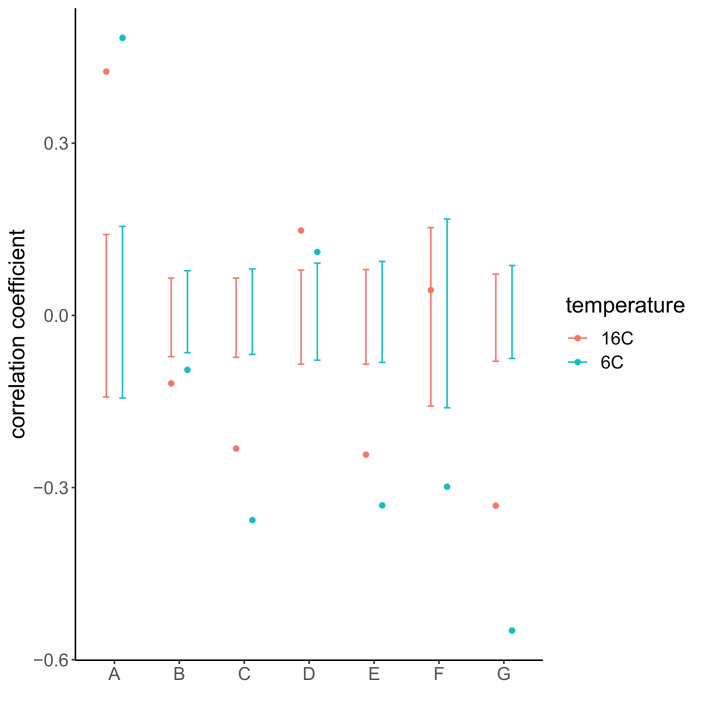
Gene-wide standardized expression at 16°C (red) and 6°C (blue) values are plotted for each gene in clusters 1–7 (A–G), as defined in Figure 3. Expression values of each gene are connected with thin lines. Thick lines represent the correlation of the cluster’s expression with the accession’s winter temperature. p-Values indicate whether the correlation with winter temperature for these genes is stronger than expected by chance (after permuting winter temperature 10,000 times) at a 5% significance threshold.
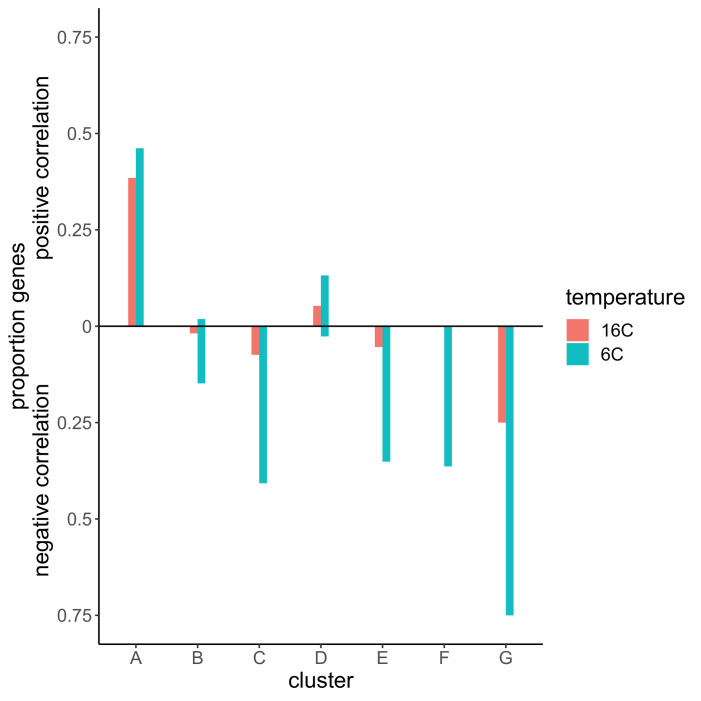
Figure 3—figure supplement 3. Proportion of genes in each cluster for which expression significantly correlated with winter temperature (fdr<0.05).

Figure 3—figure supplement 3.

Colors indicate the temperature in which expression was measured. Bars above the zero line are proportions of genes in each cluster that showed a positive correlation with winter temperature. Bars below the zero line represent proportions of genes that were correlated negatively with winter temperature.
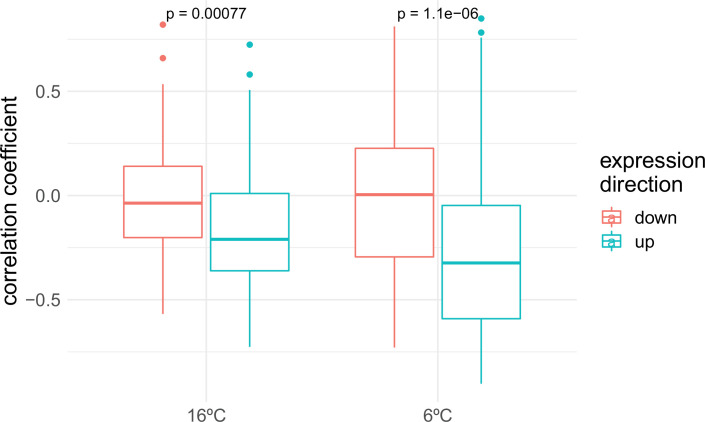
Figure 3—figure supplement 4. Gene expression correlations with winter temperature.

Figure 3—figure supplement 4.

Correlation coefficients of each gene’s correlations with winter temperature are grouped by the experimental temperature (16 and 6°C) and by the expression direction upon cold exposure as measured by Park et al., 2015 and Vogel et al., 2005.
Figure 3—figure supplement 5. Gene expression correlations with winter temperature compared to background genes.

Figure 3—figure supplement 5.

Correlation coefficients of the different clusters as defined in Figure 3 are compared to 10,000 permutations of random sets of background genes for each cluster. Points represent the correlation coefficients for each cluster of cold-acclimation genes, in each temperature. Error bars represent the 2.5 and 97.5% quantiles of 10,000 permutations with random sets of background genes.