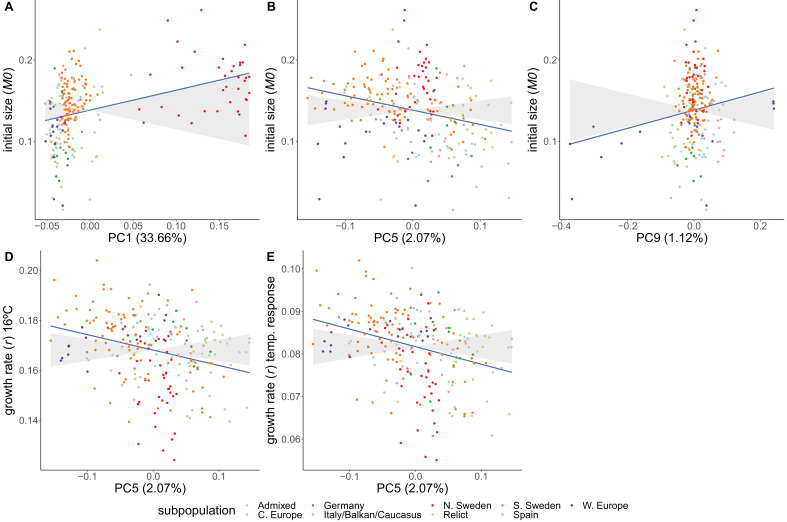
Figure 5. Adaptive differentiation of initial size, growth rate at 16°C, and the temperature response of growth rate along different axes of genetic differentiation.
Plots represent the phenotypes and axes of genetic differentiation for which we detected significant adaptive differentiation; initial size and PC6 (A), growth rate in 16ºC and PC5 (B), and the growthrate's temperature response and PC5 (C). Accessions are colored according to their respective admixture groups, as specified in 1001 Genomes Consortium, 2016. The gray ribbon represents the expected correlation between phenotype and axis of genetic differentiation under neutrality with a 90% confidence interval. The neutral expectation is based on axes of genetic differentiation within populations (see ‘Materials and methods’ and Josephs et al., 2019 for further details). The blue line represents the observed correlation between phenotype and axis of genetic differentiation. Percentages refer to the genetic variation explained by the respective principal component.


