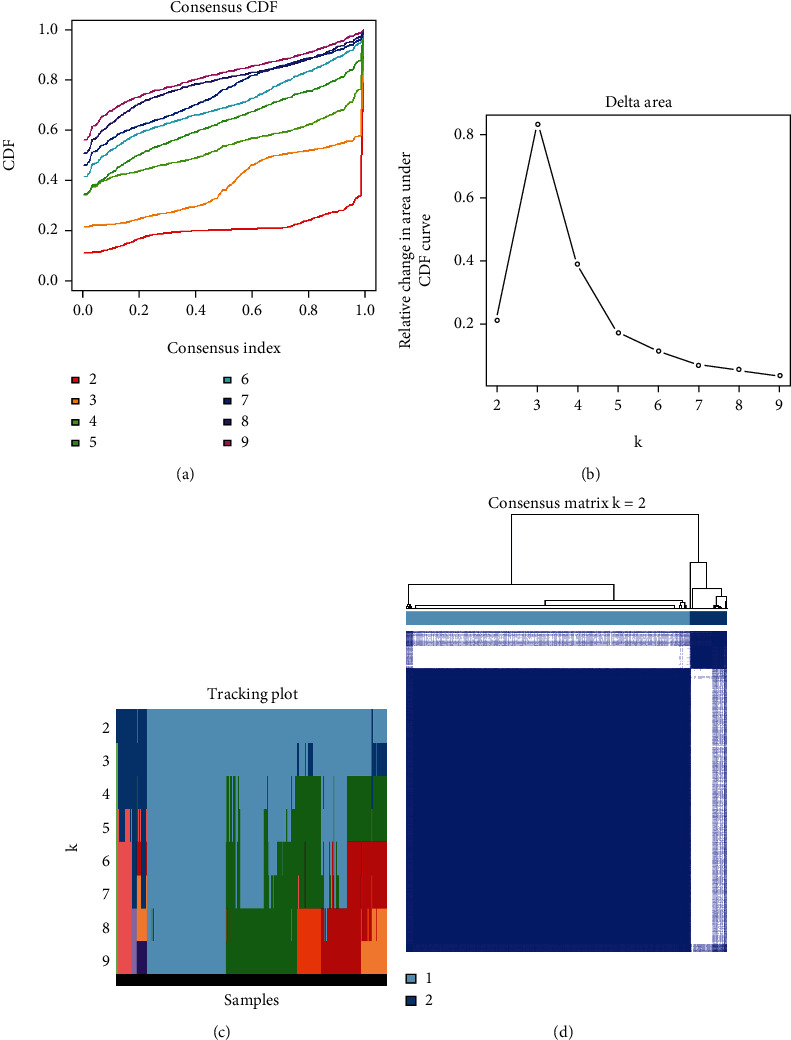
Figure 3.

Consensus clustering of the OSCC TCGA cohort based on the levels of expression of 36 prognostic m6A-relevant lncRNAs (n = 368). (a) CDF for k = 2–9. (b) Increment in the area under the CDF curve for k = 2–9. (c) Tracking plot for k = 2–9. (d) Consensus matrix for the optimal value, i.e., k = 2. OSCC: oral squamous cell carcinoma; TCGA: The Cancer Genome Atlas; CDF: consensus clustering distribution function.
