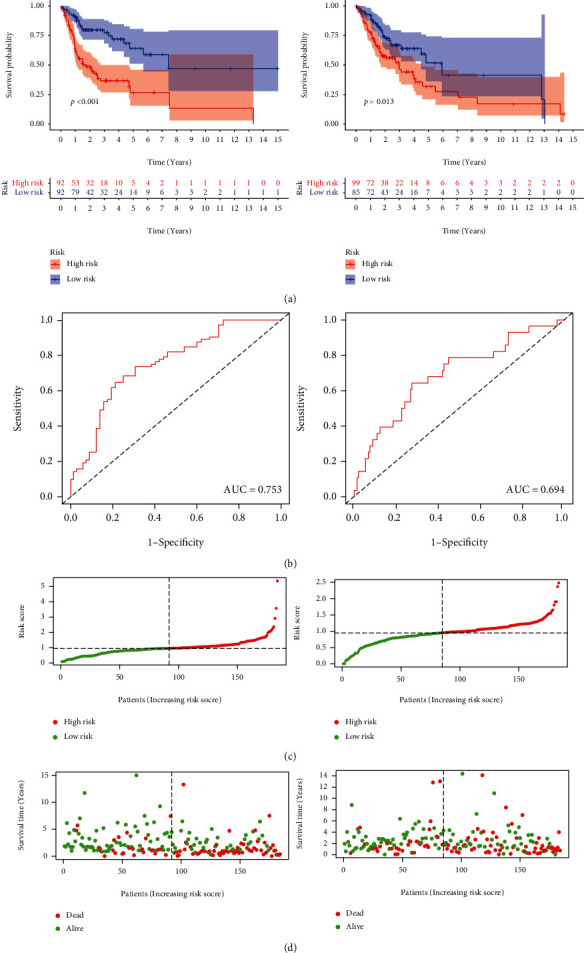
Figure 5.

(a) The Kaplan-Meier analysis of patients present in the low-risk group and high-risk group in the test and training groups. (b) ROC curves of patients depicting high- and low-risk scores in the training (n = 184) and test groups (n = 184) (AUC = 0.75 and 0.69, respectively). (c, d) Risk plots and survival state of patients which present in the low-risk group and high-risk group in the test and training groups. ROC: receiver operating characteristic; AUC: area under the curve.
