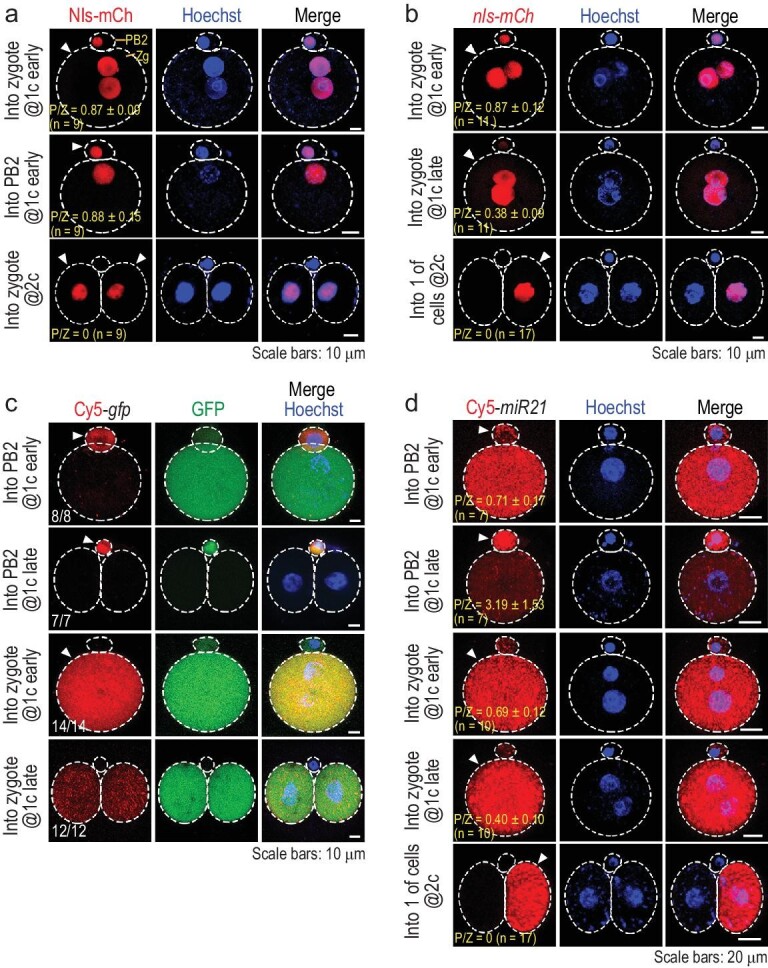
Figure 2.

Protein and RNA transport between PB2 and the zygote. The embryos were injected at an indicated stage and directly observed by confocal microscopy ∼4 h post injection. The injected cell is indicated by an arrowhead. DNA/nucleus was stained by Hoechst 33342. The ratio of observed embryos with the representative pattern is indicated at the bottom left corner. Zg, zygote. (a) Transport of injected Nls-mCherry protein. (b) Transport of Nls-mCherry following nls-mCherry mRNA. (c) Transport of Cy5-labeled full-length gfp mRNA. The ratio of embryos with the representative pattern is indicated. (d) Transport of Cy5-labeled miR21-3p RNA. P/Z, ratio of mean signal intensity in PB2 to that in the zygote (a), (b) and (d); n, the number of observed embryos.
