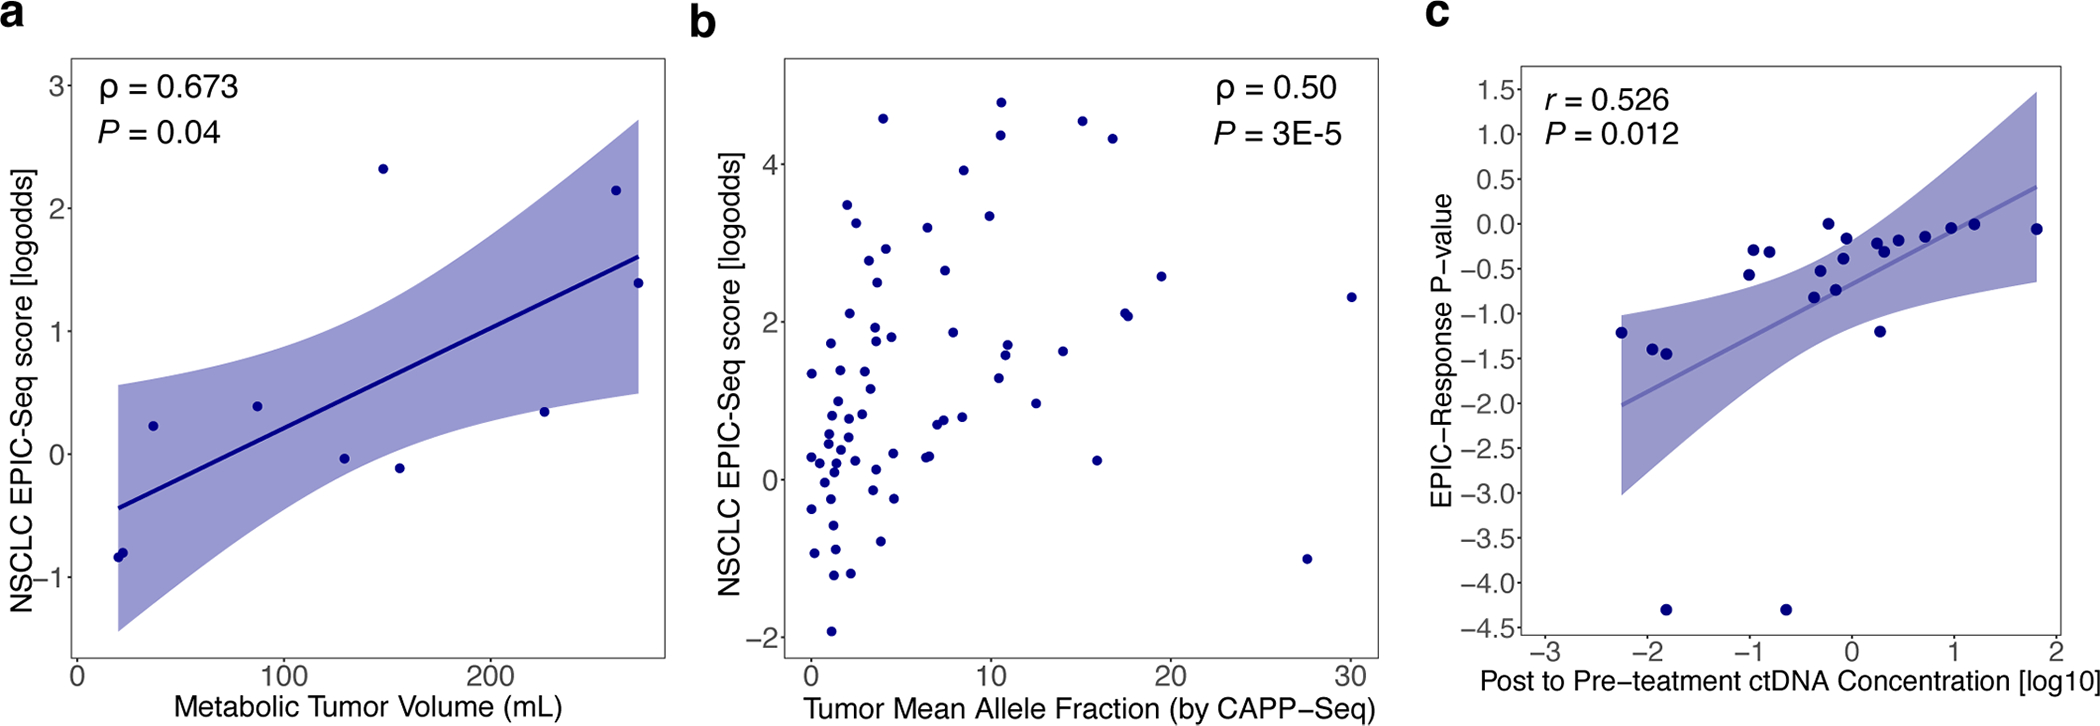
Extended Data Fig. 4 |. Correlation between EPIC-lung score and clinical factors.

Concordance between EPIC-Seq measurements and established NSCLC risk factors including metabolic tumor burden, ctDNA level, and ctDNA response. (a) Concordance between EPIC-lung score and metabolic tumor volume (MTV), as measured by Spearman correlation (ρ = 0.67; P = 0.04). (b) Concordance between EPIC-lung score and the ctDNA mean allele fractions as measured by CAPP-Seq, evaluated using Spearman correlation (ρ = 0.5; P = 3E-5). (c) Relationships between genetic versus epigenetic molecular responses to Immune Checkpoint Inhibitor (ICI) therapy in advanced NSCLC. Scatterplot compares molecular responses measured noninvasively by CAPP-Seq (x-axis; fold change, Log10) and EPIC-Seq (lung dynamics score; y-axis) using serial plasma profiling before and after ICI therapy. The two orthogonal measures show moderate but significant correlation (r = 0.53, P = 0.012).
