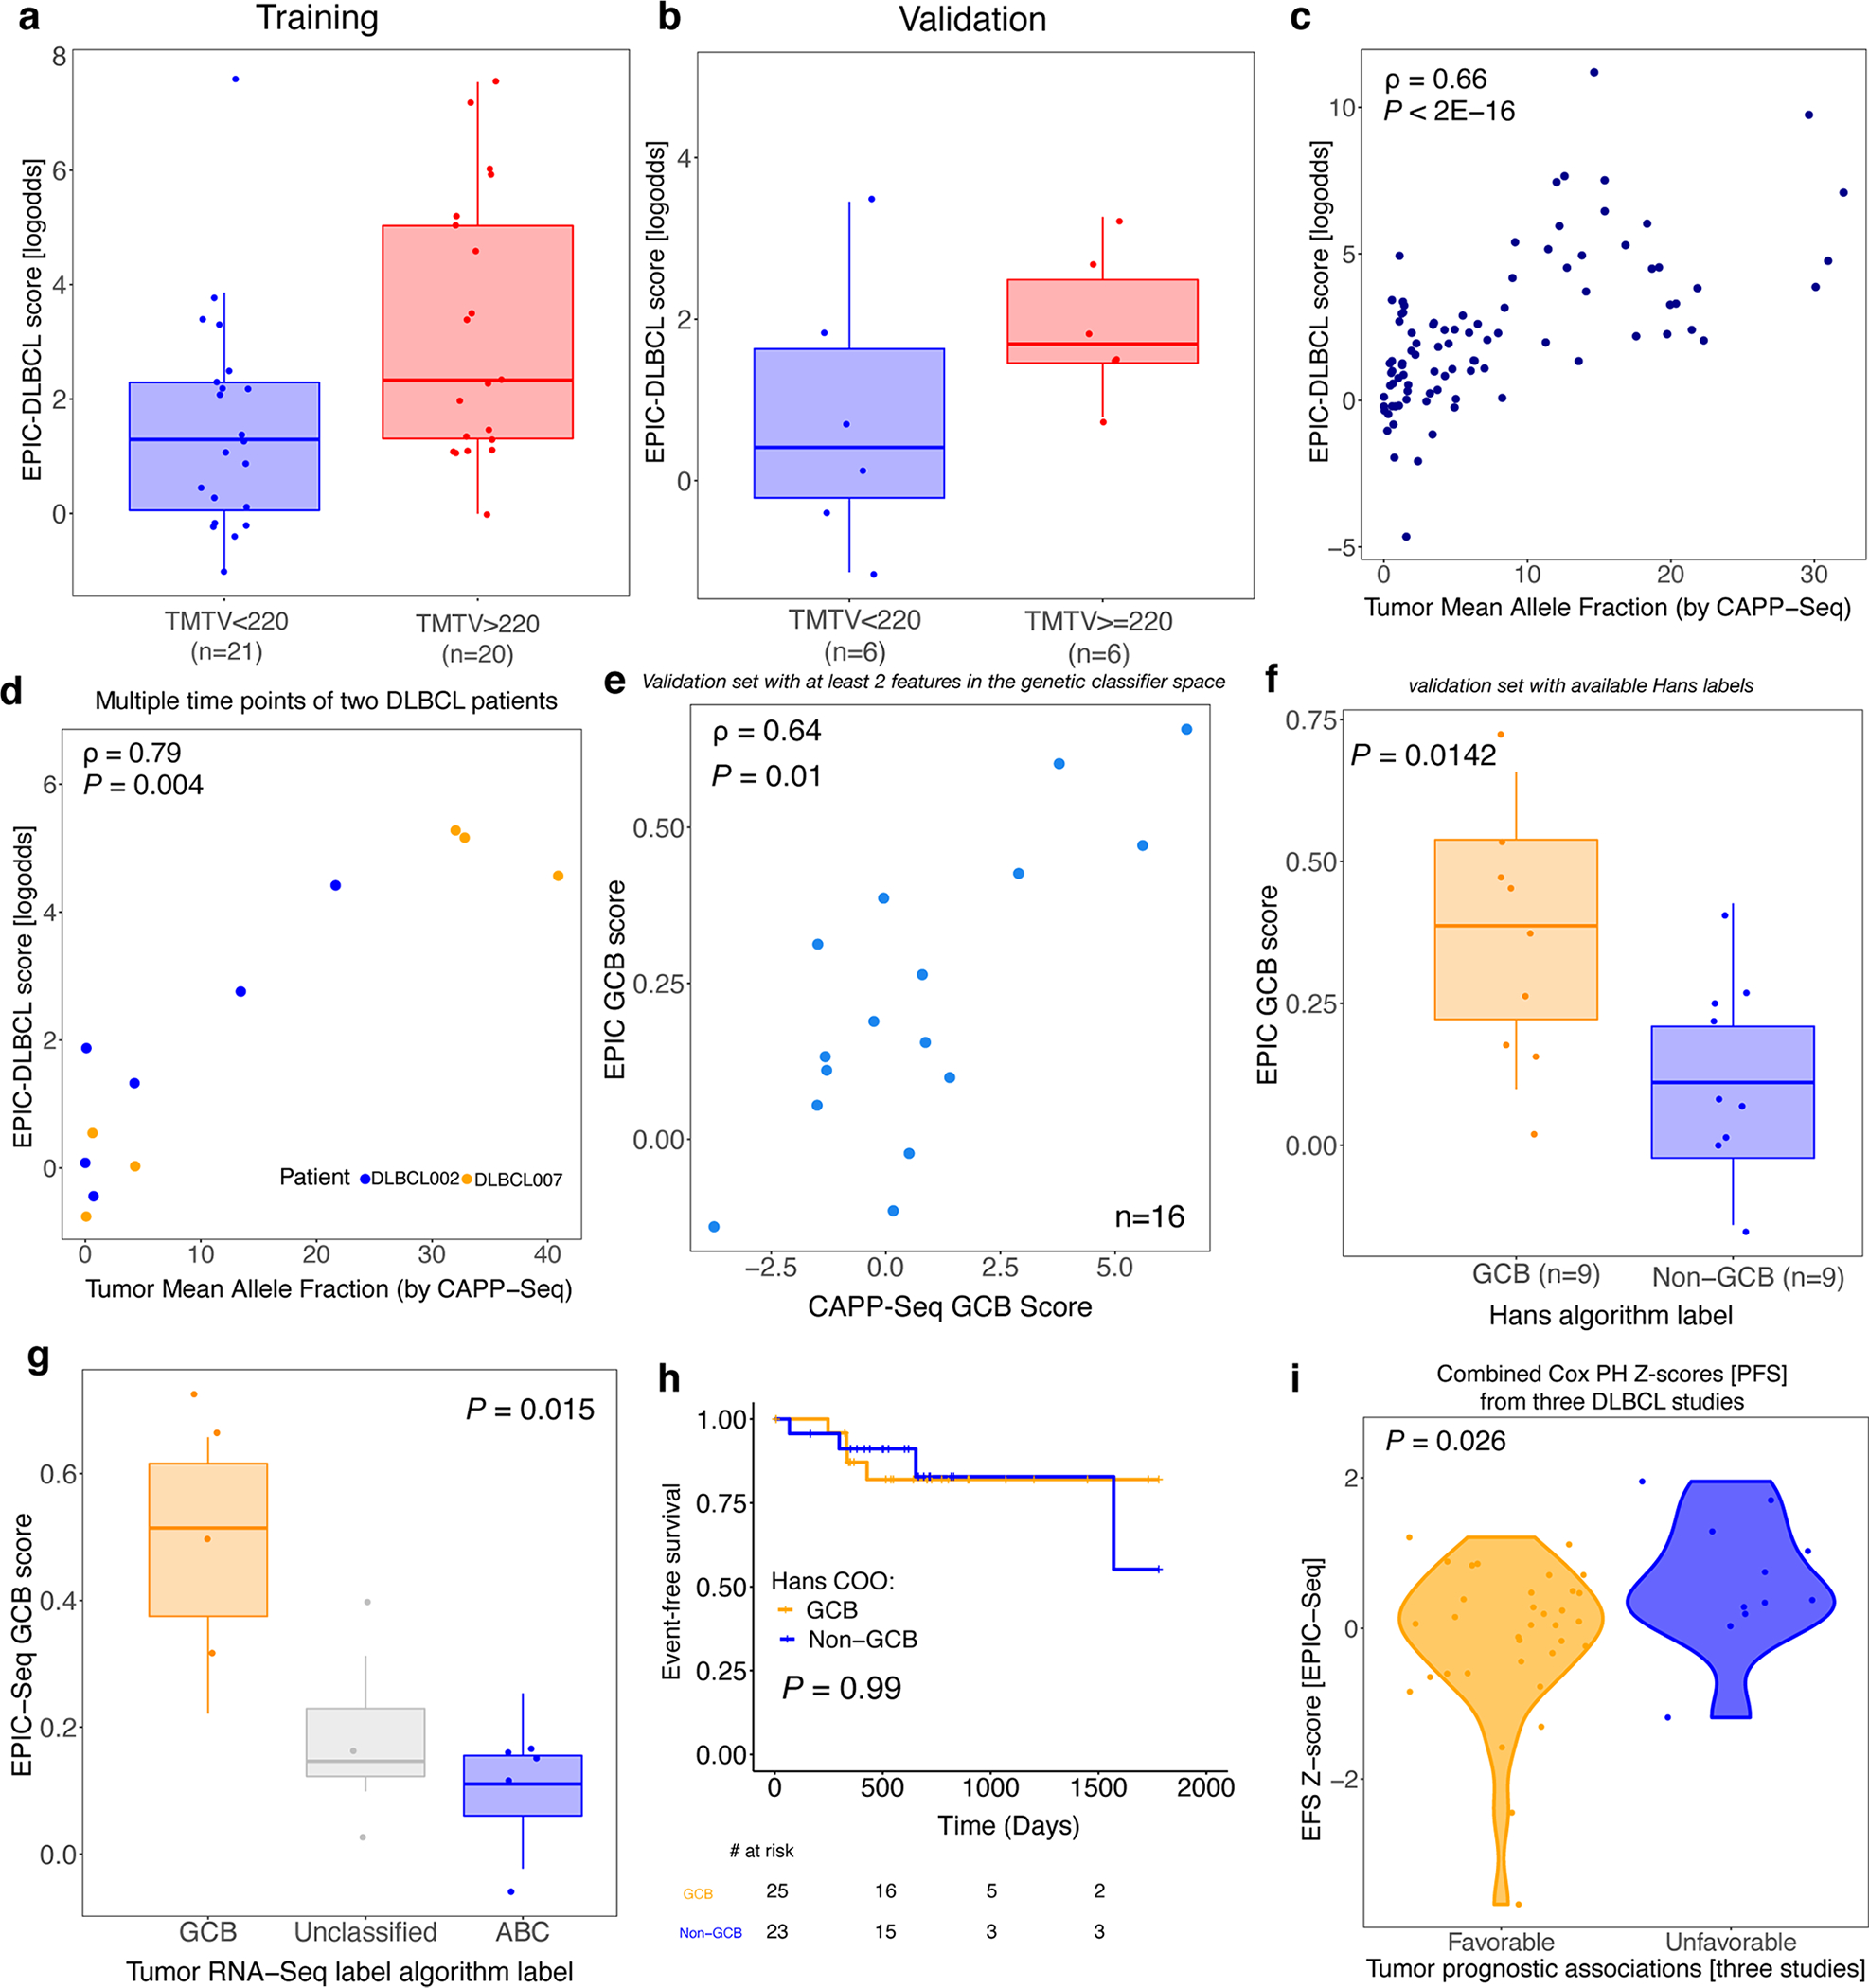
Extended Data Fig. 5 |. Correlation between EPIC-lymphoma score and clinical factors, results of the validation set and prognostic value of the LMO2 distal promoter.

Concordance between EPIC-Seq measurements and established DLBCL risk factors impacting outcome, including metabolic tumor volume, ctDNA level, and Cell-of-Origin. (a) The boxplots illustrate the two groups of patients stratified by their metabolic tumor volumes (>220 vs <220 mL; Wilcoxon P = 0.015). (b) Similar to panel a, but for the DLBCL Validation Cohort. (c) Concordance between EPIC-DLBCL scores and ctDNA mean allele fractions (from CAPP-Seq), evaluated using Spearman correlation (ρ = 0.66; P < 2E-16). (d) The EPIC-DLBCL model is applied to the cfDNA profiles of 13 samples from two DLBCL patients (DLBCL002 [ABC] and DLBCL007 [GCB]). The concordance between the resulting scores and the ctDNA mean allele fractions is evaluated by Spearman correlation (ρ = 0.79; P = 0.004). (e) Relationship between DLBCL cell-of-origin EPIC-Seq GCB scores and mutation-based GCB scores as measured by CAPP-Seq in the validation set (Spearman ρ = 0.64, P = 0.01). Each dot represents one sample (related to Fig. 6a). (f) Relationship between EPIC-Seq GCB scores from cfDNA and matched tumor tissue classification by routine Hans immunohistochemical algorithm in the validation set (Wilcoxon P = 0.001; related to Fig. 6b). (g) Relationship between EPIC-Seq GCB scores from cfDNA and tumor classification by RNA-seq of paired tumor tissue (Jonckheere’s trend test, P = 0.015). Box-and-whisker plots depict the EPIC-Seq GCB score in individual samples profiled by EPIC-Seq (dots), with boxes spanning the inter-quartile range; the median is horizontally marked with a line in each box, and whiskers span the 1.5 IQRs. (h) The Kaplan-Meier curves of EFS of the patients when labeled by the Hans algorithm. The non-GCB group contains both Non-GCB and Unknown. (i) The violin plot shows the distributions of Cox Proportional Hazard Model Z-scores when genes are grouped according to their effects on outcome (measured as EFS) in three prior tumor studies.
