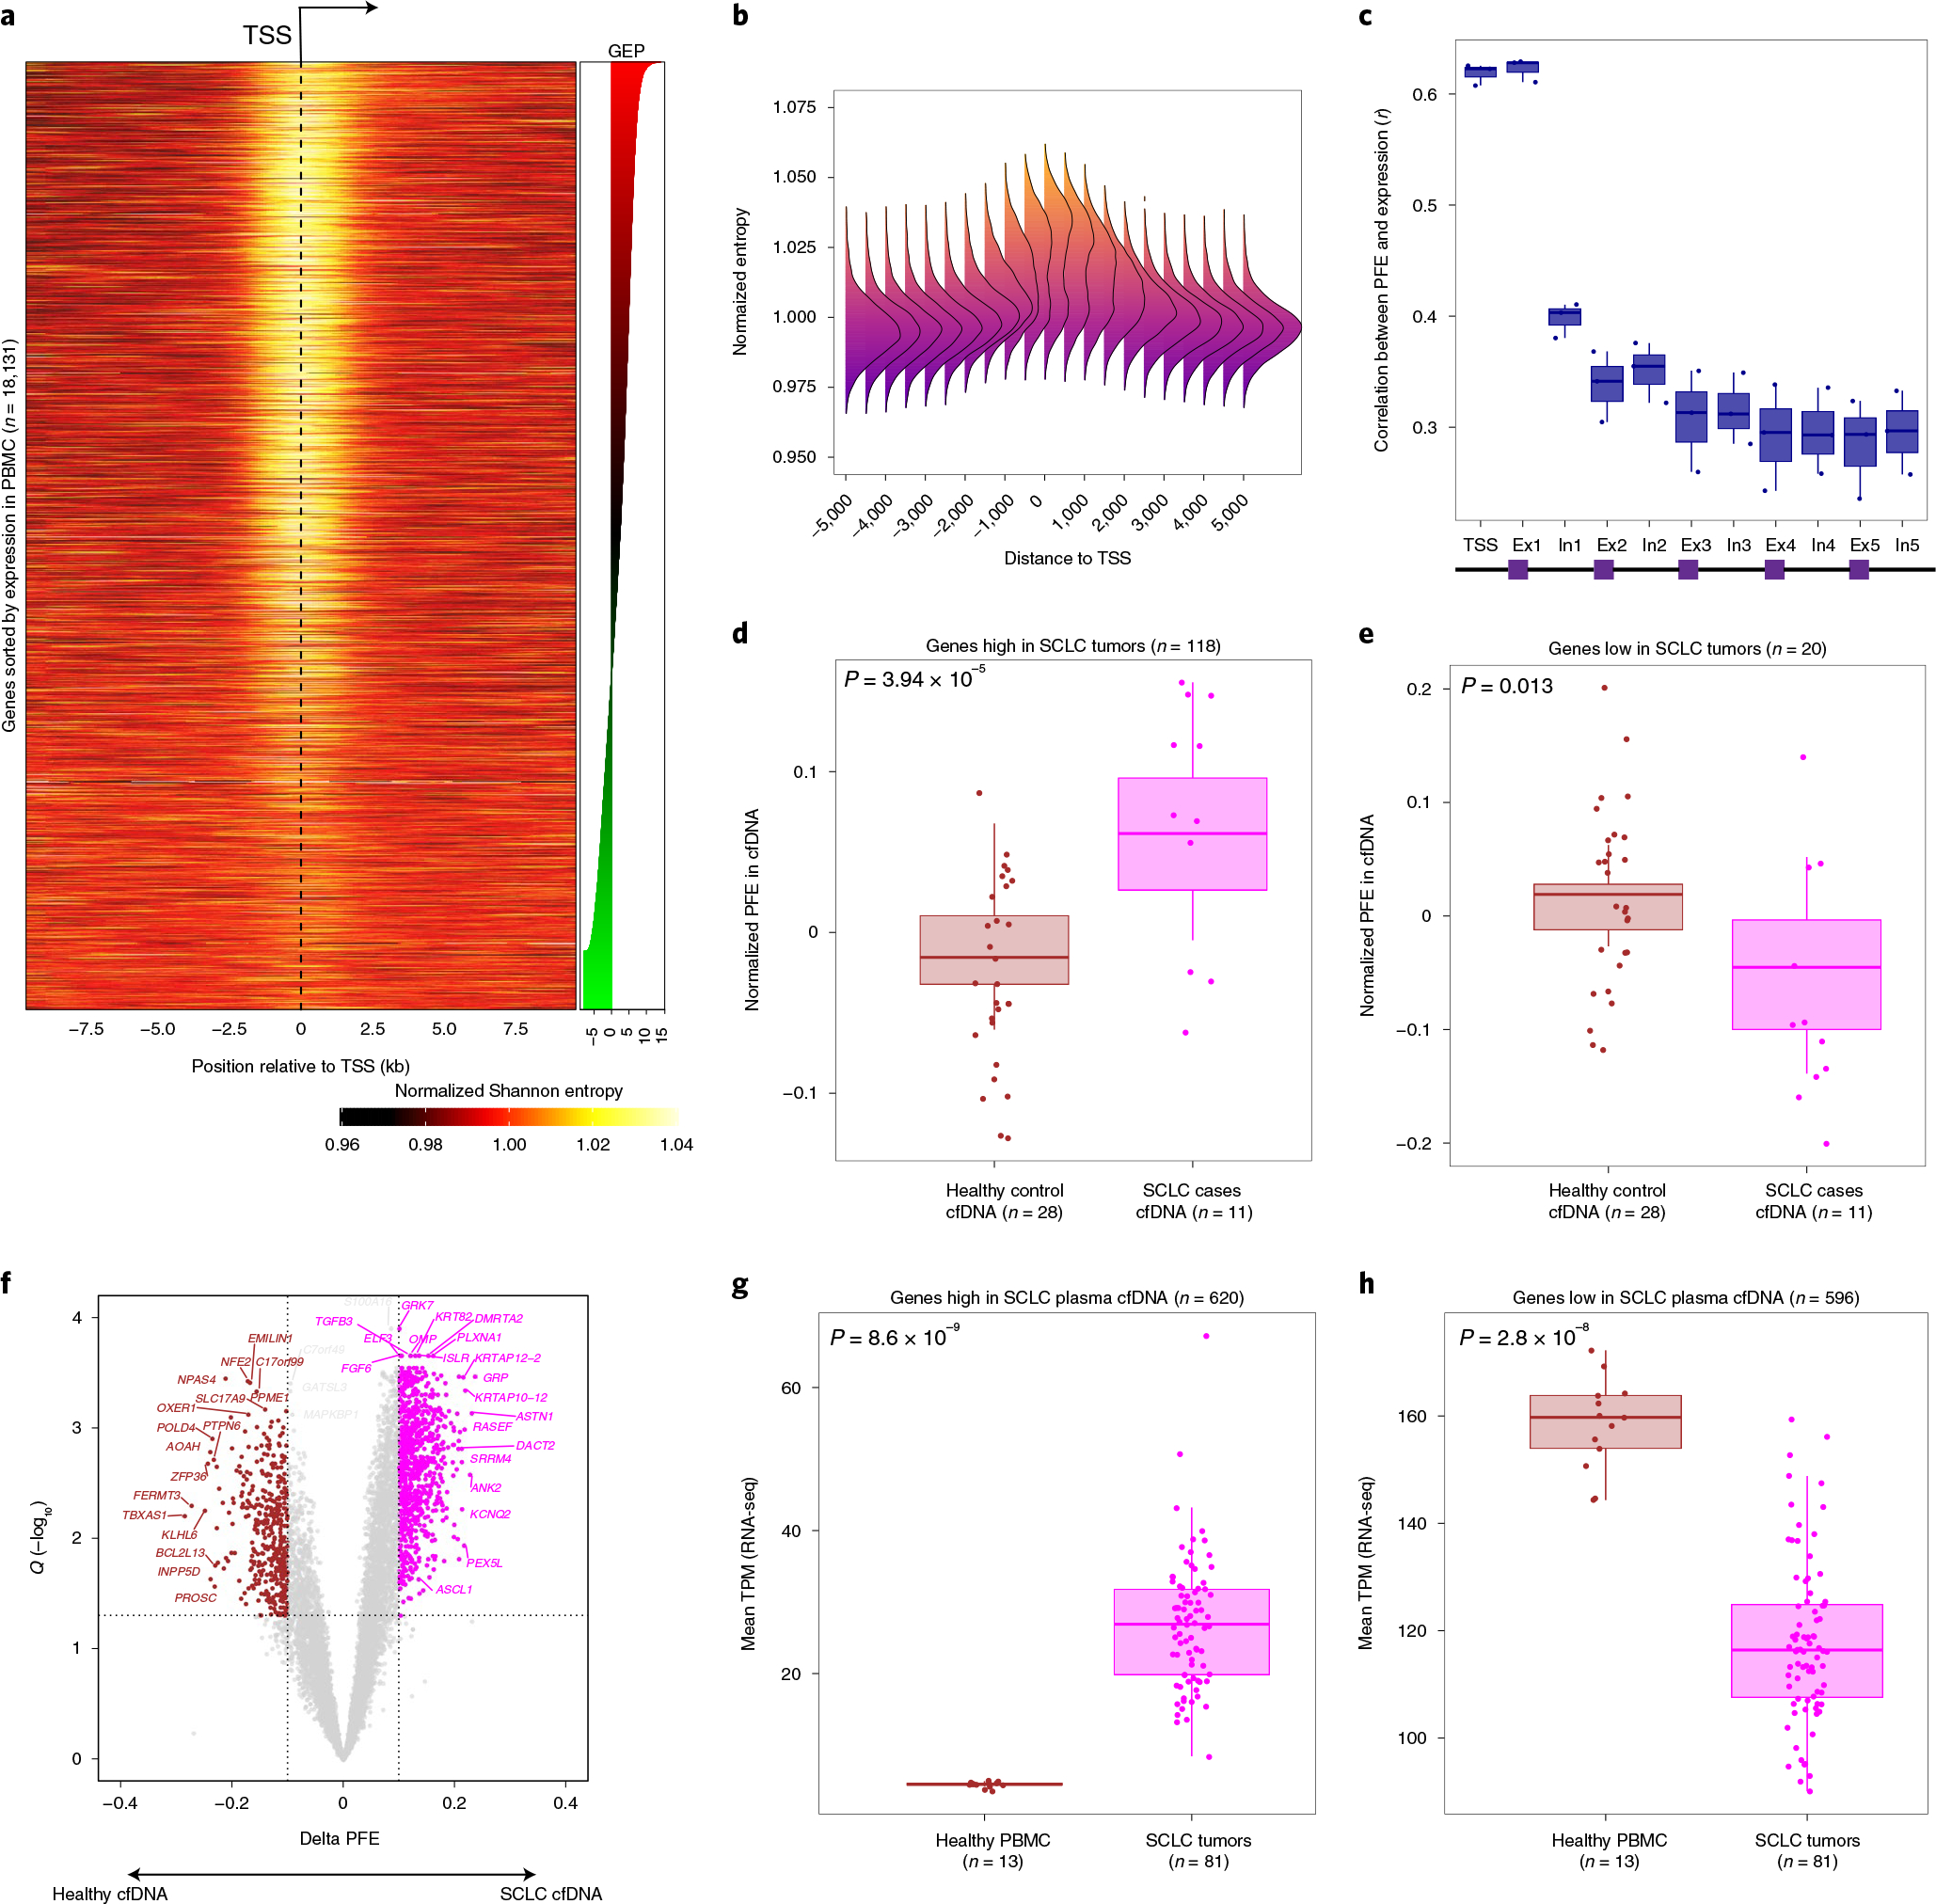
Fig. 2 |. Fragment size entropy in relation to gene structure informs expression inferences from whole-exome cfDNA profiling.

a, Heatmap depicting the mean normalized Shannon entropy of cfDNA fragment size distributions for 18,131 individual protein-coding genes when sorted by their expression in blood PBMC leukocytes, across a 20-kb region flanking each TSS. The heat illustrates the normalized entropy (normalization to the average entropy over the start to end of this 20-kb region). The underlying data are the deep whole-genome cfDNA profile from Fig. 1b. b, A summary representation of the heatmap in a. Each column reflects a window position across the TSS and is summarized by a histogram depicting the deviation of Shannon from the window centered at the TSS (position 0). c, Concordance analysis using a Pearson correlation between individual gene expression and PFEs when calculated in TSS, exon 1, intron 1 and so on. Each dot corresponds to one cfDNA sample profiled deeply by WGS (n = 3, Methods). d, Genes known to be highly expressed in SCLC tumors by RNA-seq (n = 118 genes from 81 tumors) exhibit significantly higher PFE in cfDNA samples from patients with SCLC (n = 11, pink dots) than healthy adult control participants (n = 28, brown dots; P = 3.94 × 10⁻⁵), as profiled by deep (roughly 2,000×) WES (Methods and Supplementary Fig. 1g). e, As in d, but showing significantly lower average PFE in cfDNA of patients with SCLC, when considering 20 genes known to be lowly expressed in SCLC tumors but highly expressed in PBMCs by RNA-seq (P = 0.02). f, DEGs associated with SCLC, identified directly from cfDNA using PFE analysis. Volcano plot depicts genes inferred to be more highly expressed in 11 cfDNA samples from SCLC cases (pink dots, n = 620), or in 28 cfDNA samples from healthy adult control participants (brown dots, n = 596). DEGs were determined by considering the magnitude of mean PFE difference between groups (x axis; |0.1|) and the false discovery rate (Q < 0.05) from t-tests between groups. These two sets of genes discovered noninvasively from cfDNA as differentially expressed in SCLC, were then assessed for expression in primary SCLC tumors in g and h. The box-and-whisker plots depict the median and IQR of the mean RNA expression levels (y axis, TPM) observed for the SCLC high (g) and SCLC low (h) gene sets, when comparing RNA-seq in SCLC tumors (n = 81, pink dots) versus healthy PBMCs (n = 13, brown dots). In all the box-and-whisker plots, the median is horizontally marked with a line in each box, and whiskers span the 1.5 IQRs in each patient cohort.
