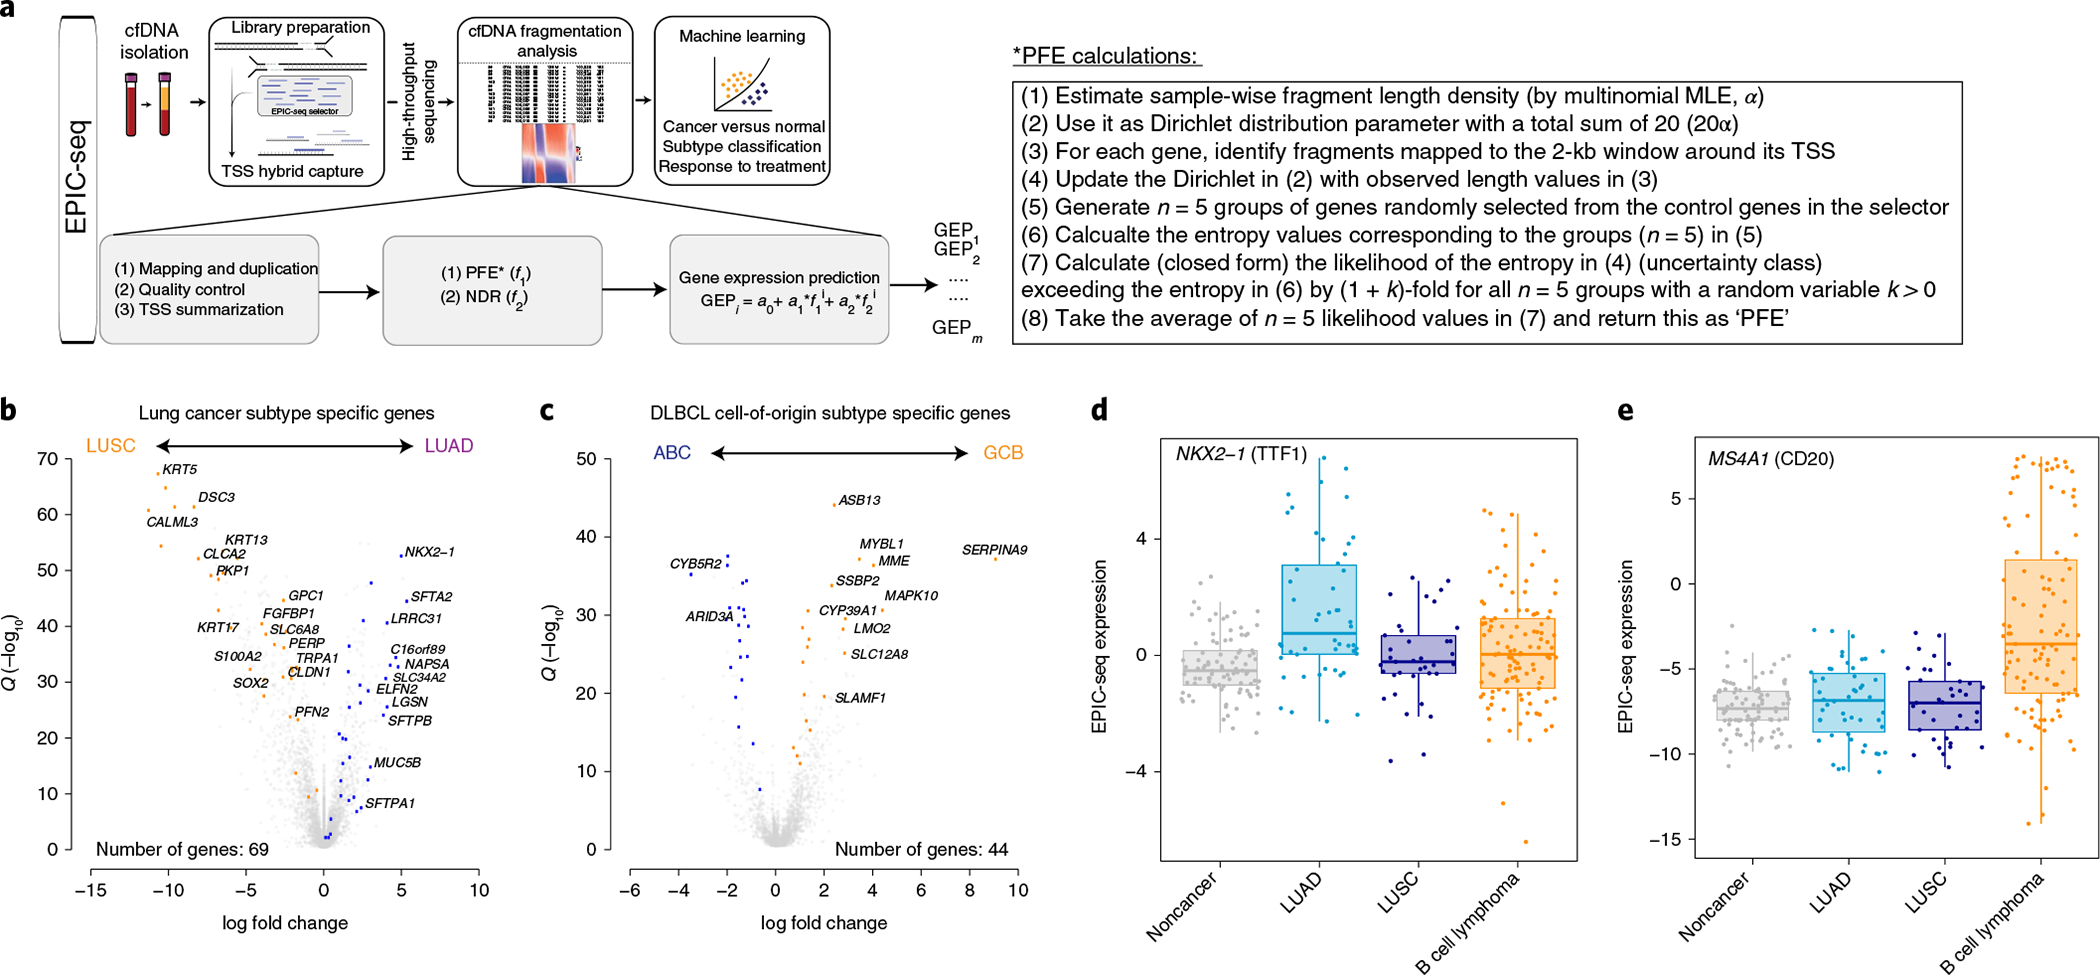
Fig. 3 |. EPIC-seq design and workflow.

a, The schema depicts the general workflow of EPIC-seq, starting with cfDNA extraction from plasma, library preparation and capture of TSS of genes of interest, high-throughput sequencing of enriched regions and, finally, cfDNA fragmentation analysis followed by machine learning models for prediction of expression at each TSS and classification of the specimen. b,c, The volcano plots depict DEGs, as informative for histological classification in NSCLC subtypes (b) (LUAD versus LUSC from TCGA36,37) and in COO classification of DLBCL (c) (ABC versus GCB from Schmitz et al.101). Genes highlighted in colors other than gray were selected for TSS capture in EPIC-seq, after censoring genes with high expression in blood leukocytes (Methods). d, NKX2-1, encoding TTF1, known to be highly expressed in NSCLC-LUAD tumors, exhibits significantly higher predicted expression in cfDNA of patients with LUAD by EPIC-seq (LUAD versus others Wilcoxon test P = 5.7 × 10⁻⁶). e, MS4A1, encoding CD20, known to be a marker of DLBCL tumors, exhibits significantly higher predicted expression in cfDNA of patients with DLBCL by EPIC-seq (DLBCL versus others Wilcoxon test P = 5.44 × 10⁻⁹). Box-and-whisker plots depict predicted expression levels in individual samples profiled by EPIC-seq (dots), with boxes spanning the IQR; the median is horizontally marked with a line in each box, and whiskers span the 1.5 IQRs in each patient cohort. In d and e, individual patients are shown as dots (noncancer, n = 91; LUAD, n = 50; LUSC, n = 37; B cell lymphoma, n = 114).
