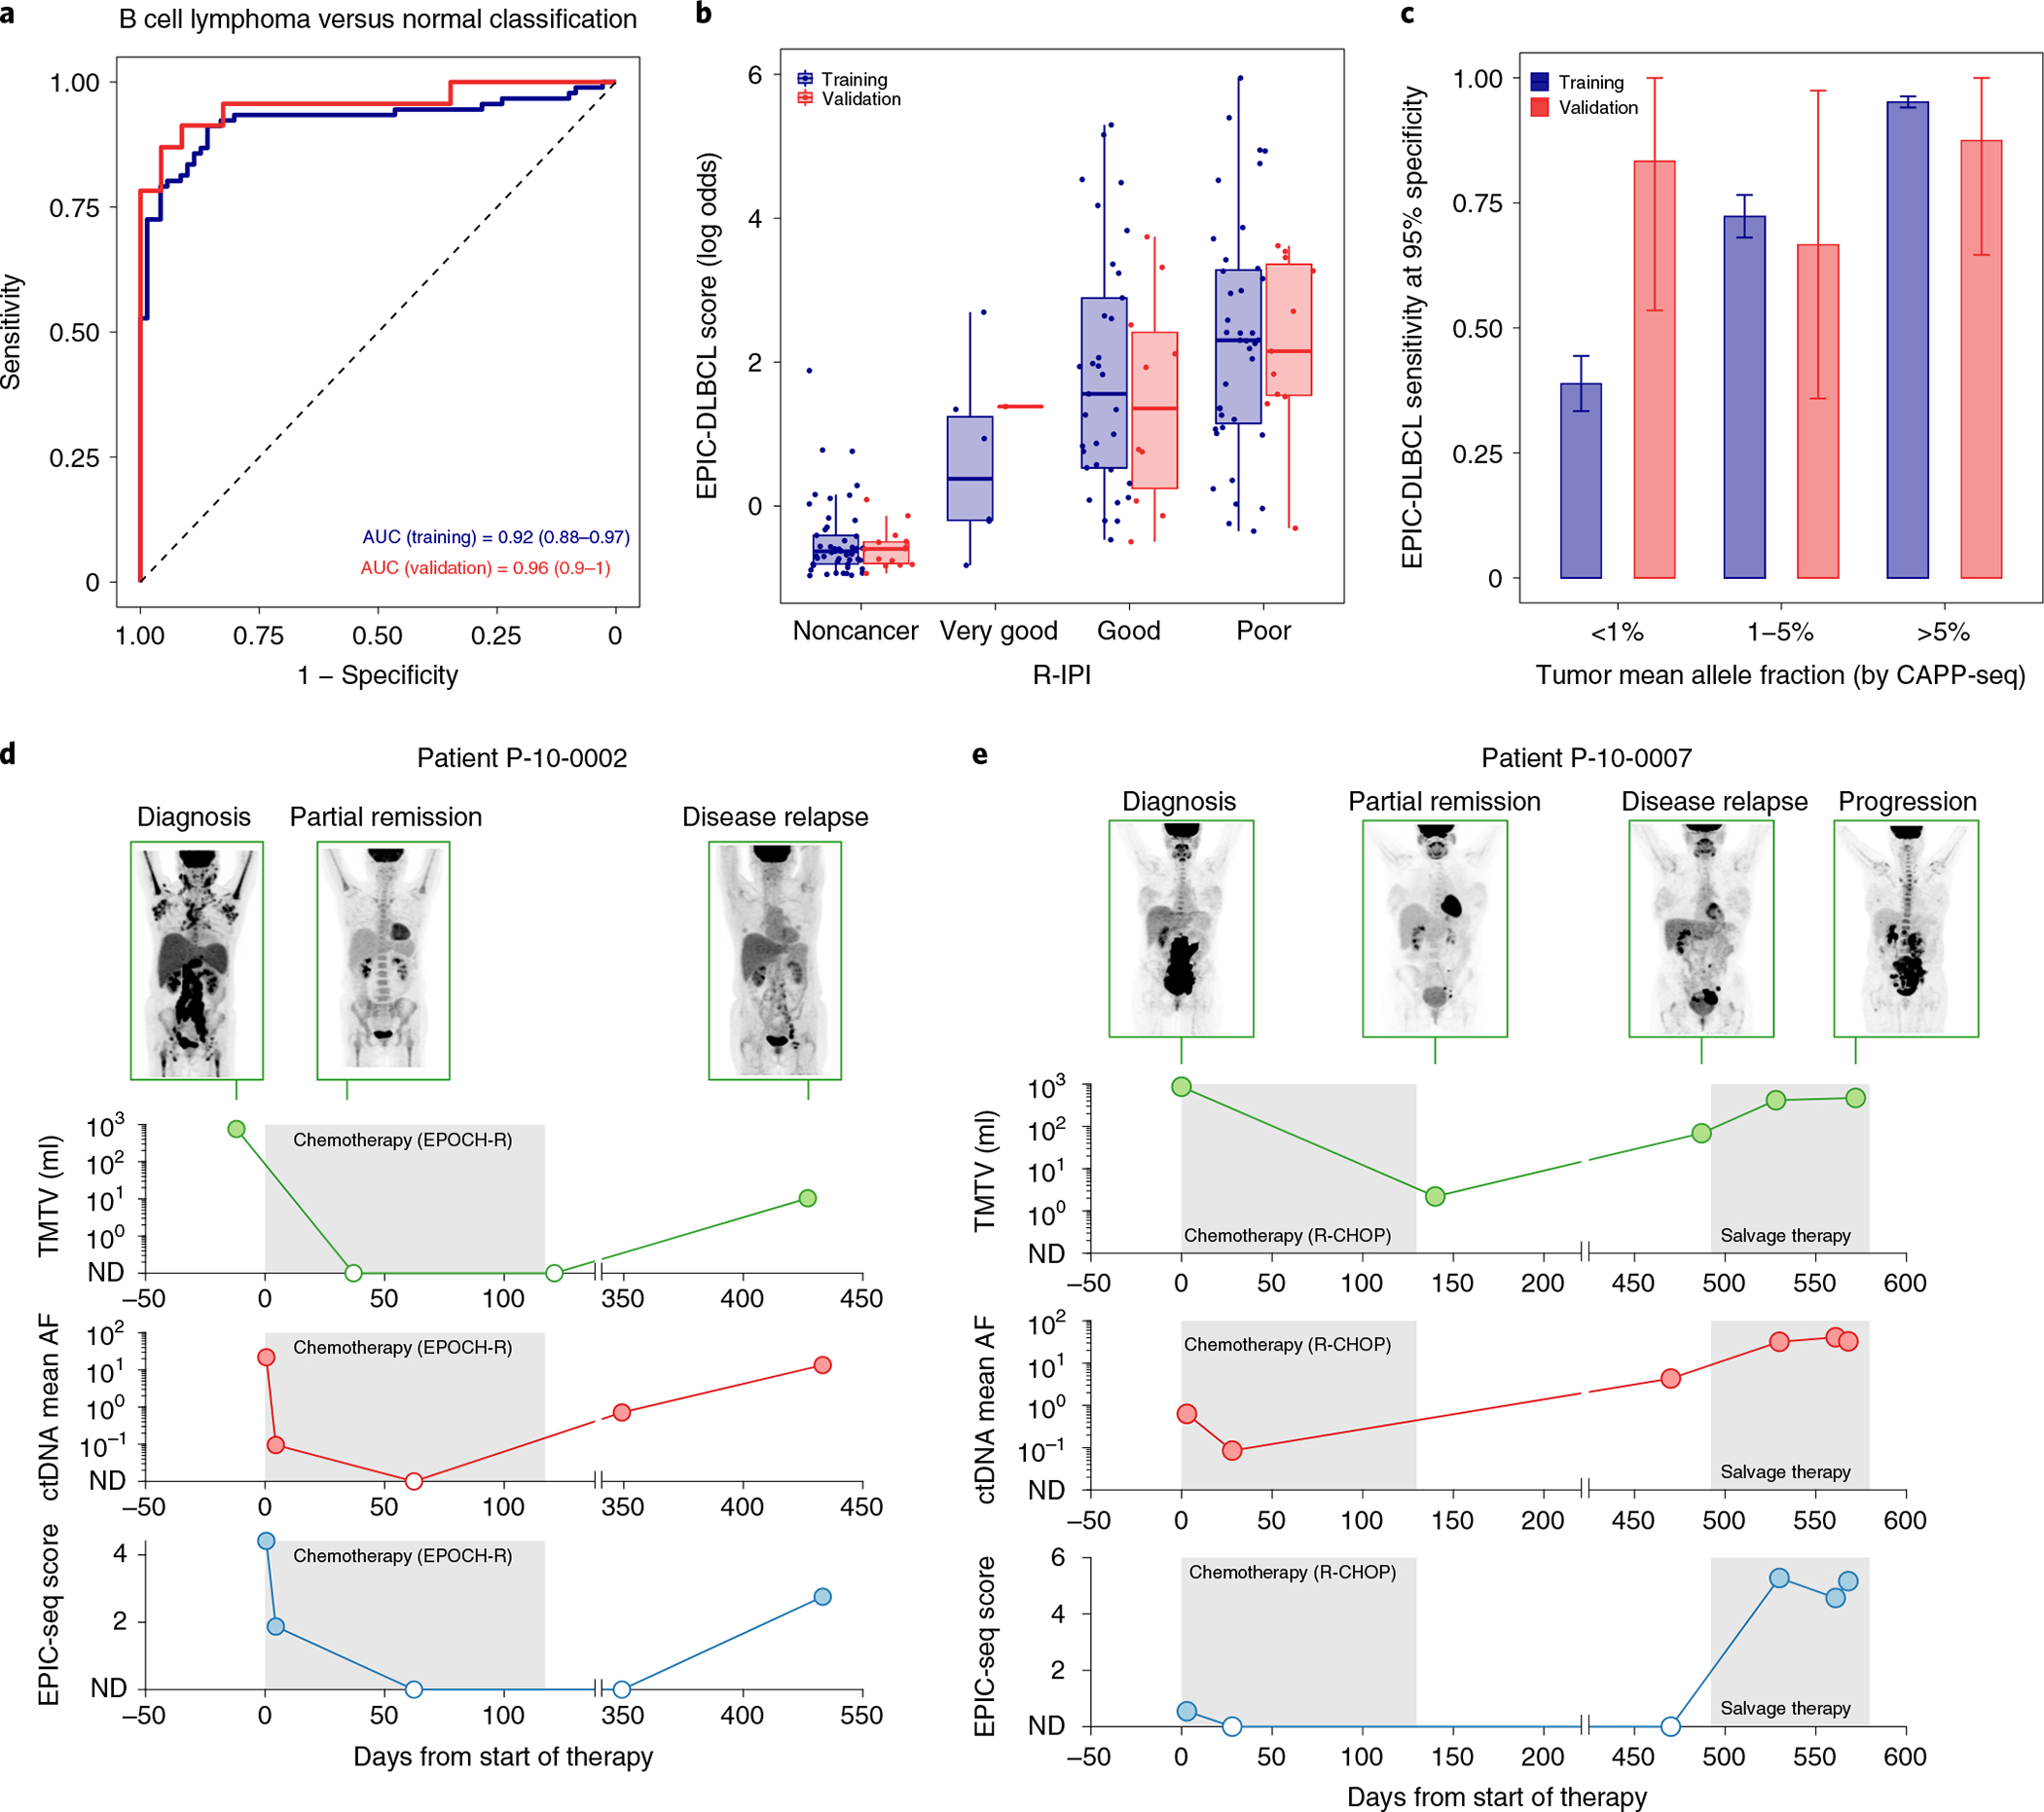
Fig. 5 |. Application of EPIC-seq for DLBCL detection.

a, ROC analyses capture performance of the EPIC-DLBCL classifier for distinguishing lymphomas from others. Red and blue curves depict performance in the validation cohort (AUC = 0.96), versus leave-one-batch-out cross-validation analyses of the training cohort (AUC = 0.92), respectively. b, Relationship between EPIC-seq DLBCL classifier scores and clinical prognostic scores as measured by the R-IPI (Jonckheere’s trend test P = 4 × 10⁻⁴). Box-and-whisker plots depict the EPIC-DLBCL score in individual samples profiled by EPIC-seq (dots), with boxes spanning the IQR; the median is horizontally marked with a line in each box and whiskers span the 1.5 IQRs. Sample sizes are as follows: noncancer (n = 71 training; n = 23 validation); ‘very good’ (n = 7 training; n = 1 validation); ‘good’ (n = 38 training; n = 11 validation) and ‘poor’ (n = 46 training; n = 11 validation). c, Sensitivity analysis at 95% specificity for EPIC-DLBCL classifier. Similar to the EPIC-lung cancer classifier, sensitivity significantly improves as a function of ctDNA level (<1% (n = 16 training; n = 6 validation), 1–5% (n = 34 training; n = 9 validation) and >5% (n = 41 training; n = 8 validation). The error bars in the training set depict the 95% CI of the sensitivity values resulted from 500 bootstrap replicates. The error bars for the validation set depict the sensitivity in the set ±s.e.m. taking the sample size into account. d,e, Change of ctDNA disease burden in response to treatment and during clinical progression in two patients with DLBCL with GCB (d) and ABC (e) COO. Shown is the radiographic response as measured by PET/CT MTV (first row y axis), ctDNA mean AF measured by CAPP-seq (second row y axis) and the EPIC-seq lymphoma score (third row y axis) over serial, pre- and post-therapy time points (x axis).
