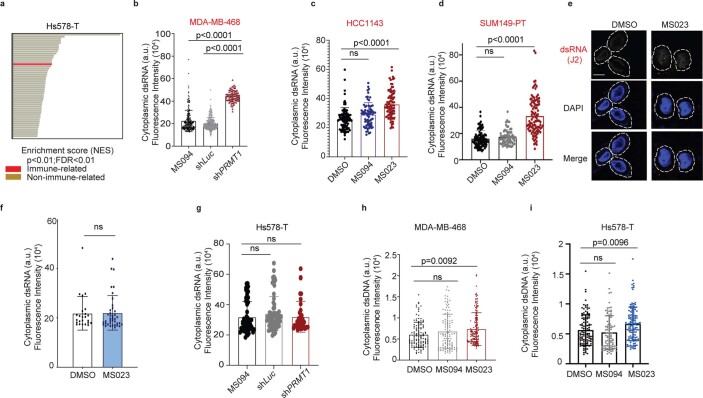
Extended Data Fig. 5. MS023 triggers interferon response through dsRNA accumulation.
a. Upregulated gene sets enriched in Hs578-T cell after MS023 treatment for 5 days. Gene sets associated with immune response are red (one-tailed Fisher’s exact test). b. Quantification of cytoplasmic dsRNA signal intensity in MDA-MB-468 cells with indicated compound or shPRMT1 for 5 days (means±s.d., n = 3 independent biologically experiments of at least 91 cells per group analyzed). c. Quantification of cytoplasmic dsRNA signal intensity in HCC1143 cells with indicated compound treatment for 5 days (means±s.d., n = 3 independent biologically experiments of at least 70 cells per group analyzed). d. Quantification of cytoplasmic dsRNA signal intensity in SUM149-PT cells with indicated compound treatment for 5 days (means±s.d., n = 3 independent biologically experiments of at least 70 cells per group analyzed). e. Images of cellular dsRNA staining in Hs578-T cell after MS023 treatment for 5 days. Scale bar represents 10 μm (Representative images of 3 independent experiments are shown). f. Quantification of cytoplasmic dsRNA signal intensity in Hs578-T cell after MS023 treatment for 5 days (means±s.d., n = 3 of at least 40 cells per group analyzed, one-way ANOVA with Dunnett’s test). g. Quantification of cytoplasmic dsRNA signal intensity in Hs578-T cells with indicated compound or shPRMT1 for 5 days (means±s.d., n = 3 independent biologically experiments of at least 45 cells per group analyzed). h. Quantification of cytoplasmic dsDNA signal intensity in MDA-MB-468 cells with indicated compound treatment for 5 days (means±s.d., n = 3 independent biologically experiments of at least 120 cells per group analyzed). i. Quantification of cytoplasmic dsDNA signal intensity in Hs578-T cells with indicated compound treatment for 5 days (means±s.d., n = 3 independent biologically experiments of at least 43 cells per group analyzed). For panels b-d, and g-i, P values were calculated using one-way ANOVA with Dunnett’s test for multiple comparisons.

