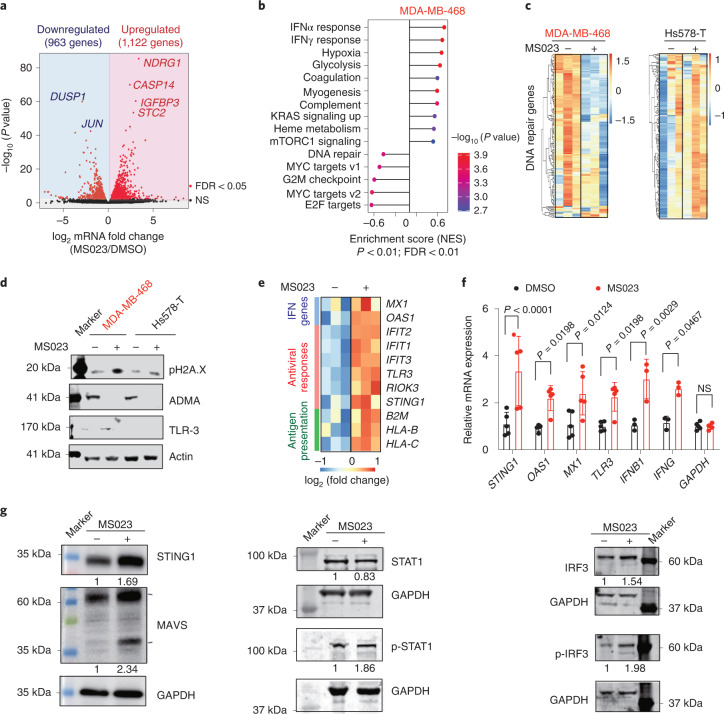
Fig. 4. MS023 treatment triggers IFN responses.
a, Volcano plot of log2 fold change for genes significantly upregulated (red, right) or downregulated (blue, left) following 5 d of MS023 treatment in the MDA-MB-468 cell line. Data were analyzed by unpaired two-tailed Student’s t-test; NS, not significant. b, GSEA of all ranked differentially expressed genes. Data were analyzed by one-tailed Fisher’s exact test; NES, normalized enrichment score. c, Heat map showing genes associated with DNA repair after MS023 treatment for 5 d in both MDA-MB-468 and Hs578-T cell lines. d, Immunoblots showing the expression level of pH2AX, a DNA damage marker, with either DMSO or MS023 treatment in both MDA-MB-468 and Hs578-T cell lines. Data are representative of n = 3 independent experiments. e, Heat map showing RNA-seq data for indicated genes in MDA-MB-468 cells with either DMSO or MS023 treatment for 5 d. f, Expression of indicated IFN-responsive genes in MDA-MB-468 cells with either DMSO or MS023 treatment for 5 d analyzed by qRT–PCR. Data are shown as mean ± s.d.; n = 5 for STING1, OAS1, MX1, TLR3 and GAPDH; n = 3 for IFNB1 and IFNG. Data were analyzed by two-way ANOVA with Dunnett’s test for multiple comparisons. g, Immunoblots of the indicated proteins in MDA-MB-468 cells after 5 d of MS023 treatment. Normalized band intensity is labeled. Data are representative of n = 3 independent experiments; p-STAT1, phospho-STAT1; p-IRF3, phospho-IRF3.

