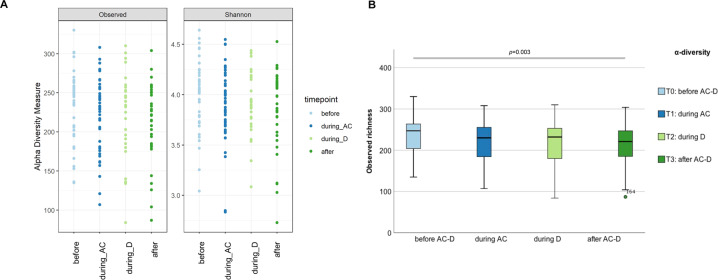
Fig. 3. Microbiota diversity before, during and after chemotherapy.
A Changes in α-diversity measures of the 28 participants who provided all four samples before AC-D, during AC, during D and after AC-D treatment, measured in terms of observed species richness (p = 0.042; n = 28) and Shannon index (p = 0.206; n = 28) (Supplementary Table 5). B Pairwise comparison (Wilcoxon signed-rank sum test with Bonferroni correction) of all samples before AC-D (n = 44), during AC (n = 43), during D (n = 29) and after AC-D treatment (n = 37) revealed significant differences in observed species richness between T0-T3 (p = 0.003; n = 37) (Supplementary Table 6). The boxplot in Fig. 3B shows the medians, IQR’s, minimum, maximum and an outlier.

