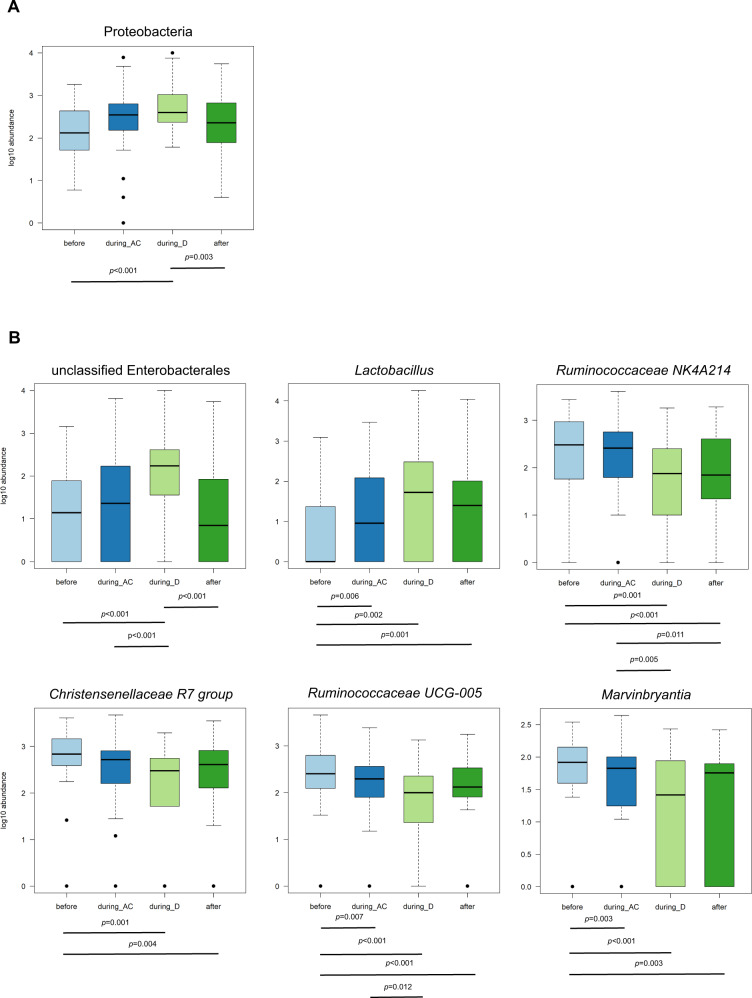
Fig. 5. Differential abundant taxa during the course of AC-D.
Log10 abundance of taxa with significant differential abundance before AC-D (n = 44), during AC (n = 43), during D (n = 29) and after AC-D treatment (n = 37). P values below boxplots indicate significant differential abundances analysed with a pairwise Wilcoxon signed-rank sum test (Supplementary Table 10). A Phylum level. B Genus level. The boxplots show the medians, IQRs, minimum, maximum and outliers.

