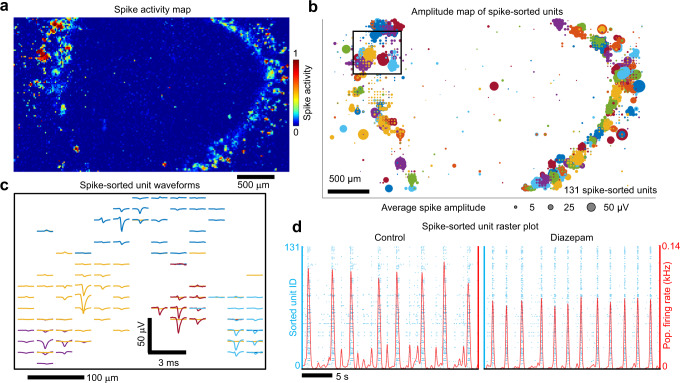
Fig. 1. High-resolution maps of extracellular action potentials across a human brain organoid slice.
a Spatial map of extracellular action potential activity recorded from a 500 µm thick human brain organoid slice positioned on a high-density CMOS microelectrode array with 26,400 recording electrodes to survey electrical activity across the entire organoid. The color scale indicates the normalized number of detected spikes (above 5x-rms noise) registered at each electrode site measured over a 30 s interval. Scale bar 500 µm. b Spatial map of the mean extracellular action potential spike amplitude (bubble size) from single-unit activity measured simultaneously across the CMOS array from the top 1020 electrode sites based on activity. A total of 131 spike-sorted units were determined by Kilosort2. Single-unit electrode clusters are plotted using the same color (the same colors are repeated for different units). c Extracellular spike waveform traces from four individual units (from the region highlighted by the black square in b) are plotted with respect to the electrode positions on the array. The sorted unit colors are the same as b. Waveform scale bars are 50 µV and 3 ms; spatial scale bar is 100 µm. d Left, raster plot of endogenous spiking activity (blue dots) measured from the 131 spike-sorted units. Red line is the average number of spikes detected across the organoid (averaged over a 100 ms Gaussian kernel). Right, same organoid after 50 µM diazepam treatment. Source data are provided as a Source Data File.

