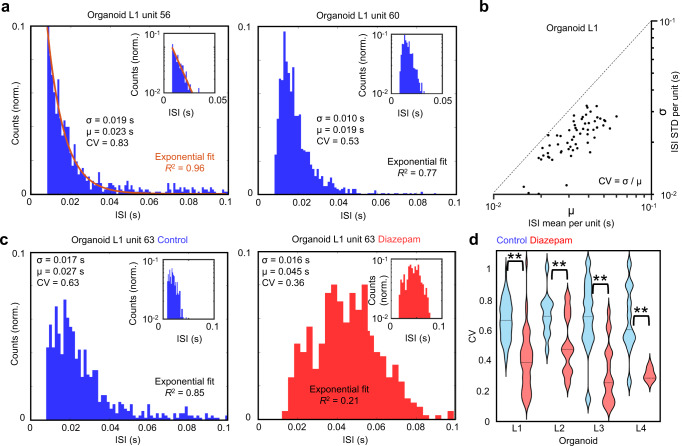
Fig. 3. Neuron interspike interval distributions from a human brain organoid slice.
a Histogram plots of interspike intervals (ISIs) from endogenous single-unit spiking activity are shown from organoid L1. The left plot shows an exponentially distributed ISI fit well by an exponential function (red line, R2 = 0.96) with a coefficient of variation (CV), defined as the ratio of ISI standard deviation (σ) to its mean (µ), close to one. The inset shows the vertical axis on a log scale. The right plot highlights a single-unit ISI with a right-skewed distribution, not as accurately captured by an exponential (R2 = 0.77), with a comparatively smaller CV. b σ is plotted as a function of µ across all units with a minimum of 30 spikes measured over a 3-min duration for organoid L1. The dotted line indicates CV = σ/µ = 1. c Single-unit ISIs shift toward lower values with smaller CV for diazepam (50 µM) treatment relative to control. The distribution of all ISI intervals across all units is shown in Supplementary Fig. 8 for multiple organoids (n = 4). d The ISI CV distributions do not vary significantly between organoids in control conditions (p > 0.4). However, there is a significant reduction in the CV when treated with diazepam (50 µM) as determined by a two-sample Kolmogorov–Smirnov (KS) test (p < 1e−4, p = 4.5e−2, p < 1e−4, p = 1.4e−2 for organoids L1, L2, L3 and L4 respectively).

