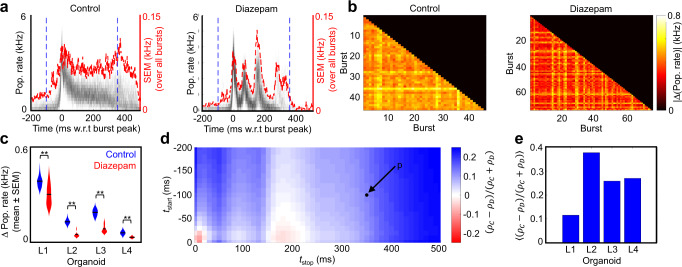
Fig. 4. Diazepam-induced changes in population-level dynamics in a human brain organoid slice.
a The population averaged firing rate (pop. rate) for the control and diazepam recordings (organoid L1 here) calculated from single-unit activity averaged over a 5 ms window. The population rate for each burst is plotted individually, centered by the peak in multi-unit activity (MUA). The standard error of the mean (SEM) calculated over all bursts is plotted in red. b Population rate average differences are shown across all individual burst pairs for the control and diazepam (50 μM) recordings from the same organoid. The average population rate difference is computed over a time window of −100 ms to +350 ms relative to the MUA peak (blue dotted line in a). The color bar scale is the same for control and diazepam. See Supplementary Fig. 10 for visualization from a separate organoid. c Average population vector differences taken over all individual burst pairs per recording for control and diazepam (50 µM) conditions. The population vector difference is computed over a time window of −100 ms to +350 ms relative to the MUA peak (blue dotted line in a). Significance between control and diazepam was determined by a two-sample KS test (p < 1e−4 for organoid L1, L2, L3 and L4). The number of pairwise burst comparison for each distribution for control and diazepam (50 µM) conditions, respectively, are (1035, 2701); (5460, 10,153); (3570, 7875); (1275, 861) for organoids L1, L2, L3 and L4 respectively. d Fractional change between population rate for control and diazepam (ρC − ρD)/(ρC + ρD), averaged over a range of different time windows for L1. Here, ρC and ρC are the average population rate differences for control and diazepam, respectively. Blue tiles indicate a higher average population vector difference for control. The black dot (p = (−100, 350 ms)) indicates the time window used in b and c. e Average score of the matrix in d for each organoid.

