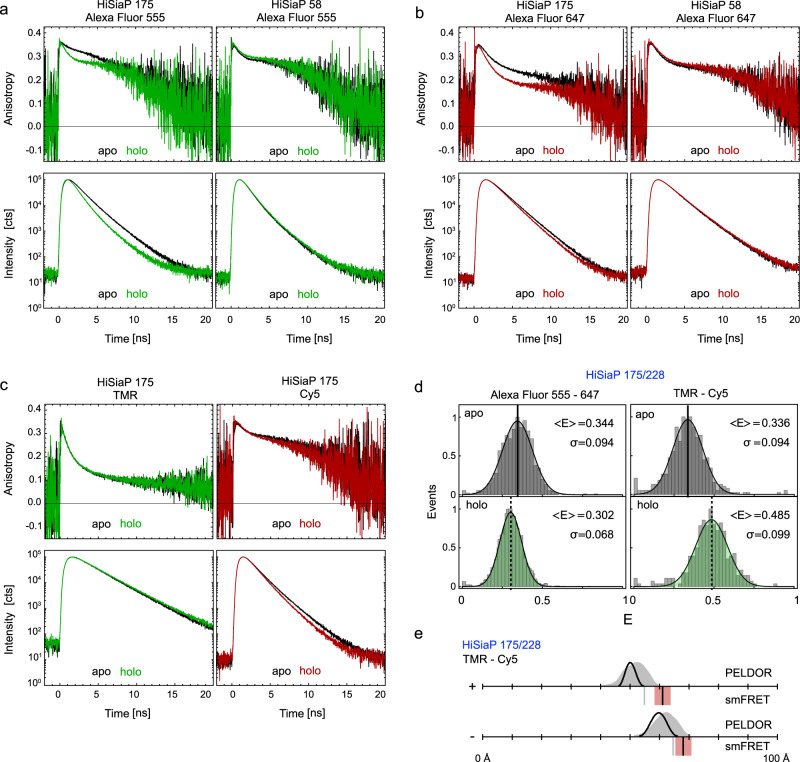
Fig. 4. Time resolved fluorescence anisotropy and lifetime measurements on HiSiaP.
a Anisotropy decay curves of Alexa Fluor 555 (top row) at residue 175 (left) and 58 (right) and lifetime decay curves (bottom row) under magic angle conditions for apo (black) and holo state (green). b Same measurements as in (a) with Alexa Fluor 647 in apo (black) and holo state (red). c Anisotropy decay curves of TMR (top left) and Cy5 (top right) at residue 175 and lifetime decay curves of TMR (bottom left) and Cy5 (bottom right) under magic angle conditions for apo (black) and holo state (coloured). d FRET efficiency distributions (centre & bottom) of HiSiaP variant 175/228 for Alexa Fluor 555 – Alexa Fluor 647 (left) and TMR – Cy5 (right) in apo (grey) and holo state (green). e Converted distances from the mean FRET efficiencies are shown as black bars (mean of n = 3 independent experiments) in comparison to simulation (grey bar) and PELDOR/DEER results from Fig. 3. The red shade around the experimental smFRET distance are error bars based on the standard deviation of n = 3 independent experiments. Source data are provided as a Source Data File.

