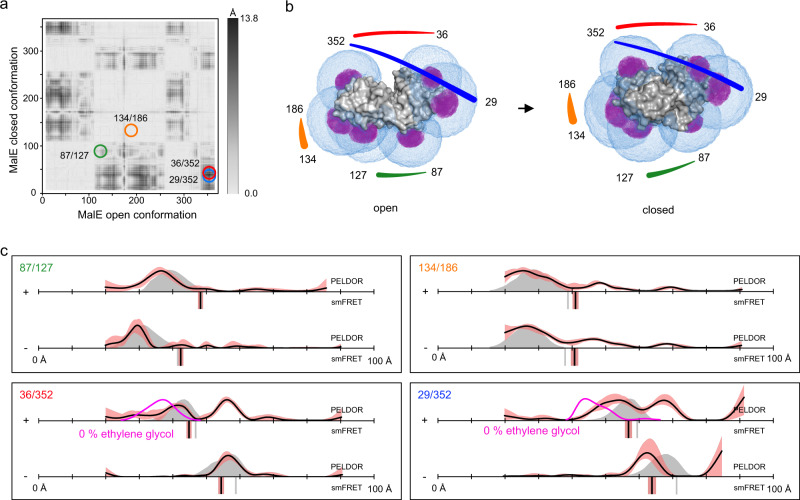
Fig. 5. Distance measurements on MalE.
a Difference distance map of MalE in the open (PDB-ID: 1OMP134) and closed (PDB-ID: 1ANF135) conformation125. Protein regions with high conformational changes are indicated as dark spots. The double variants for distance measurements are marked with circles. b Surface presentation of MalE (grey) in the open (left) and closed (right) conformation. The accessible volume of the spin label on seven different labelling positions, calculated with mtsslWizard, is represented by magenta meshes. The accessible volume of FRET label maleimide-Alexa Fluor 647, calculated with FPS67 is shown as blue meshes. The double variants that were used for experiments are identified with coloured lines, corresponding to the circles in (a). c Distance measurements with four different double variants of MalE without (−) and with (+) substrate. The PELDOR/DEER results are shown above (grey curves for simulation, black curves for experiment) and the FRET distance below the axis (grey bars for simulation, black bars are the mean of n = 3 independent experiments). PELDOR/DEER results without cryoprotectant are shown as magenta curves. The red shade around the PELDOR/DEER data is the error margin calculated using the validation tool of DeerAnalysis52. The underlying principle of the validation tool is explained in the discussion section below. The red shades around the experimental smFRET distances are error bars based on the standard deviation of n = 3 independent experiments. Source data are provided as a Source Data file.

