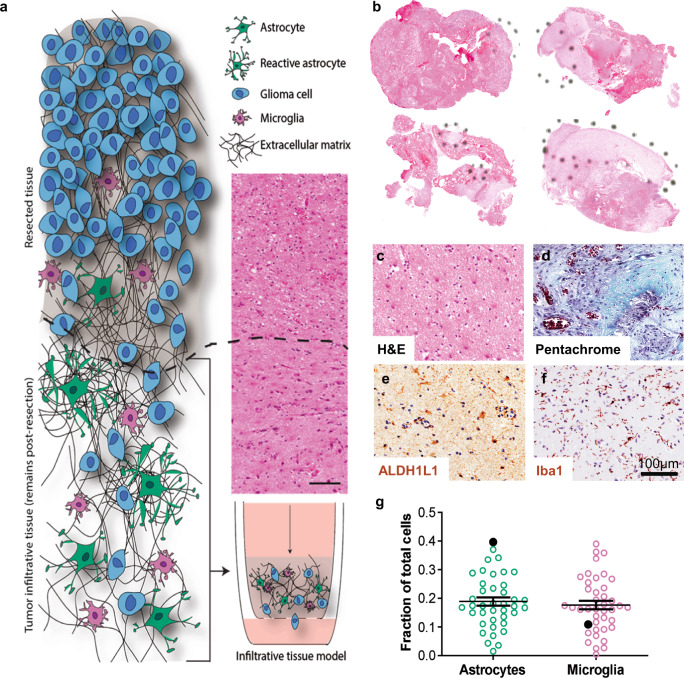
Fig. 1. Histological quantification of the invasive human glioblastoma microenvironment for in vitro model development.
a Illustration of the invasive tumor border and the patient-driven approach to develop a relevant model. b Representative bright-field scans of patient resection samples stained with hematoxylin and eosin (H&E), with dashed circles showing tumor-adjacent regions identified by a neuropathologist. c–f Representative bright-field images of chromogenic stains on serial patient samples for H&E (c), movat pentachrome (matrix and mucin staining, d), ALDH1L1 (astrocytes, e), and Iba1 (microglia, f). g Cell number quantification from our patient cohort samples (N = 40) for astrocytes and microglia, represented as a fraction of total nuclei count. Solid black circles show data from a select patient.

