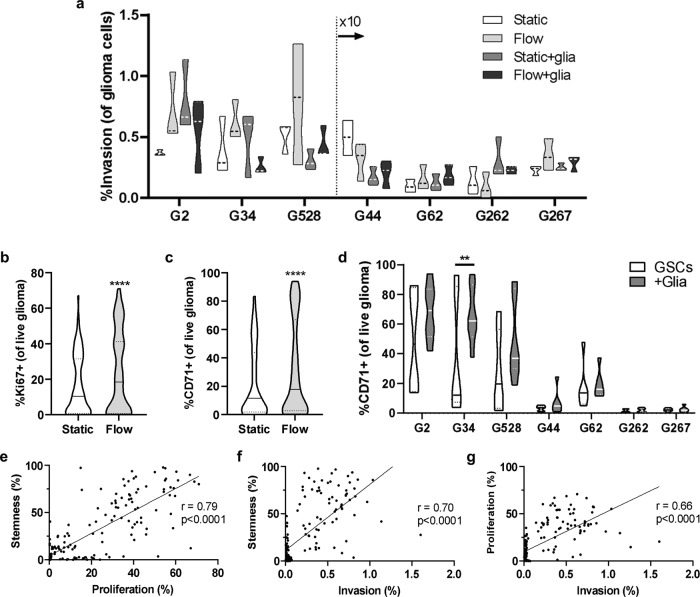
Fig. 3. Interstitial flow induces the largest effect on glioma cell proliferation and stemness, and these metrics correlate with invasion.
a Invasion data for each cell line in the presence and absence of interstitial fluid flow and/or glia (astrocytes and microglia). Each sample represents n = 3 technical replicates for n = 3 biological replicates. Data for G44, G62, G262, and G267 are multiplied by 10 to enable plotting on the same axis. b Ki67 expression data for all GSCs collected for all conditions (+astrocytes, microglia, or both) in static (white) vs in flow (light gray). c CD71 expression data for all GSCs collected for all conditions (+astrocytes, +microglia, or +both) in static (white) vs in flow (light gray). d CD71 expression data for each GSC line in static and flow when cultured alone (white) and in the presence of the TME (medium gray). Statistics were performed by paired t-tests with *p < 0.05, **p < 0.01, and ****p < 0.0001. e Correlation plot and linear regression of stemness (CD71+) vs. proliferation (Ki67+). f Correlation plot and linear regression of stemness (CD71+) vs. invasion. g Correlation plot and linear regression of proliferation (Ki67+) vs. invasion. The respective Pearson coefficients are shown in each plot for e–g.

