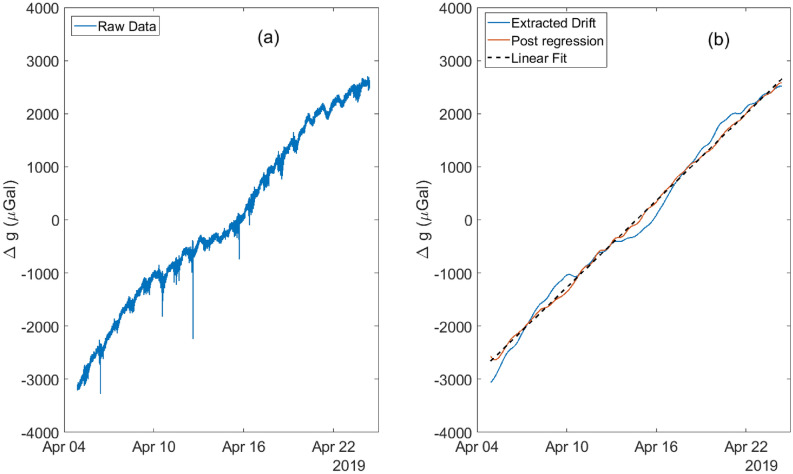
Figure 5.
The raw data (a) and the drift analysis (b) plots for the gravimeter. The raw data is first low-pass filtered to retain only very long-term features (<2 Hz) in the raw data (blue series in (b)). The extracted drift is then processed to regress out the impact of the temperature and the control instrumentation. The post-regression data (red series) is then fitted against a straight line (dashed black series) to obtain the drift rate of the gravimeter.

