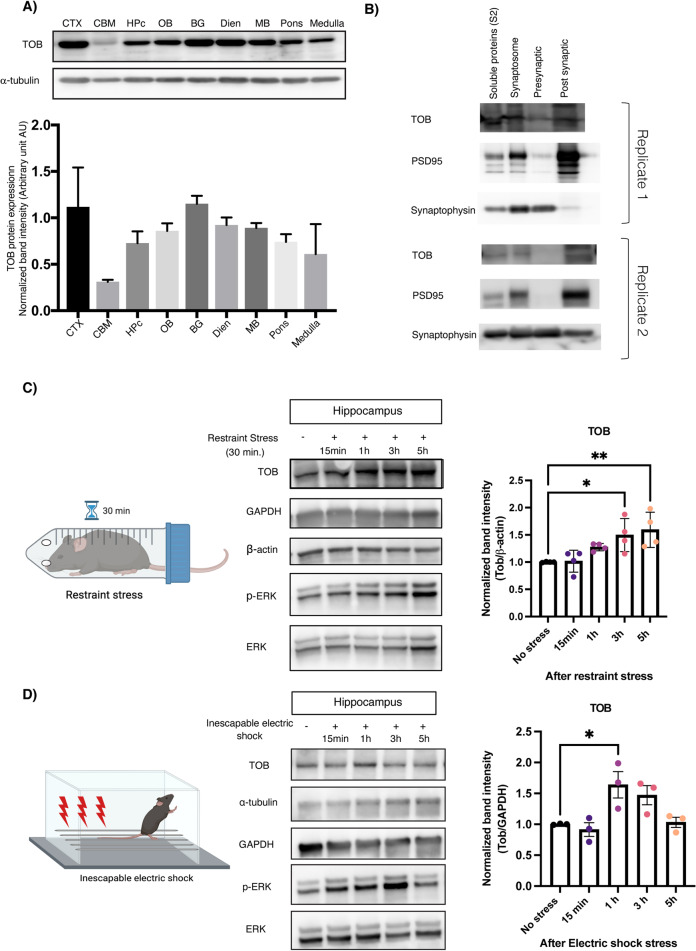
Fig. 1. TOB protein expression levels increase in response to stress.
A Expression patterns of TOB in lysates of different mouse brain regions (n = 3). B Immunoblotting of TOB, synaptophysin, and PSD-95 in hippocampal fractionated lysates: soluble fraction S2, synaptoneurosomes, pre-synaptic, and post-synaptic fractions. C Western blotting of TOB expression levels in hippocampal lysates without stress and after 30 min of restraint stress at different times: 15 min, 1 h, 3 h, 5 h after stress exposure (n = 4). D Western blotting of TOB expression levels in hippocampal lysates without stress and after inescapable electric shock for different durations: 15 min, 1 h, 3 h, 5 h post-exposure to stress (n = 3). One-way analysis of variance (ANOVA) followed by Dunnett’s post-hoc correction for multiple comparisons: statistical significance *p < 0.05 **p < 0.01 when compared to control (No stress). Data are presented as means ± SEMs.

