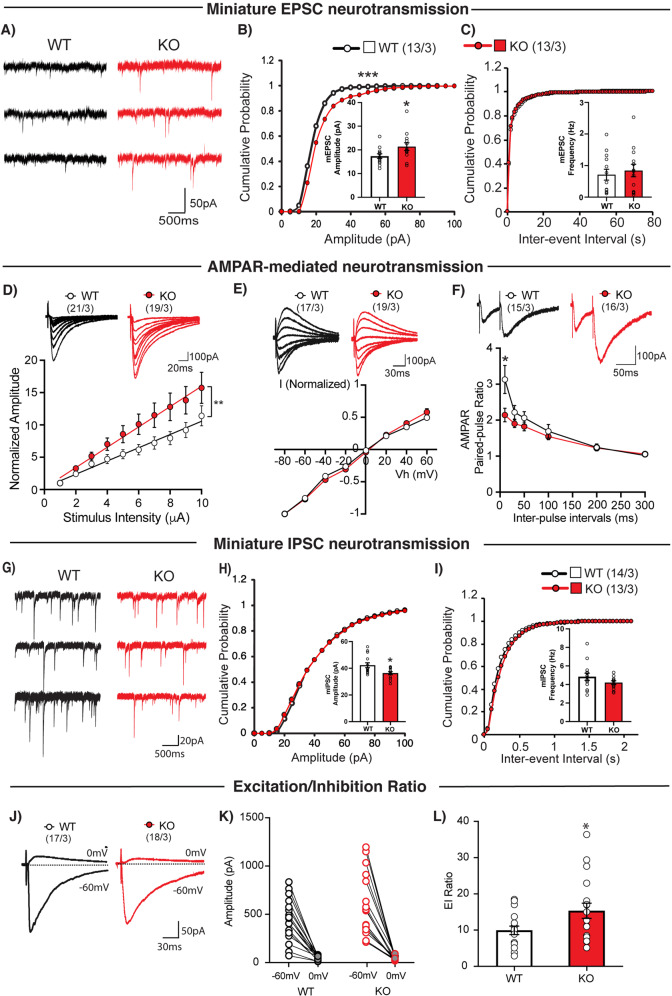
Fig. 3. Altered excitatory/inhibitory balance in Tob-KO hippocampal slices.
A Representative traces of mEPSCs recorded from hippocampal pyramidal neurons of wild-type (WT, left traces) and Tob knockout (KO, right traces) at Vh of -70 mV in the presence of 1 μM tetrodotoxin and 100 μM PTX. Scale bars, 50 pA and 500 ms. B Cumulative distribution plots and summary bar graphs for mEPSC amplitude (inset shows the average mEPSC amplitude) in CA1 hippocampal pyramidal neurons of wild-type (white column) and Tob-KO (gray column) mice. ***p < 0.0001 by Kolmogorov-Smirnov test in the cumulative distribution plot and *p = 0.0453 by unpaired Student’s t test in the bar graph. C Cumulative distribution plots and summary bar graphs for the mEPSC inter-event interval (inset shows the average of mEPSC frequency) in CA1 hippocampal pyramidal neurons of wild-type (white column) and Tob-KO (gray column) mice. p = 0.4611 by Kolmogorov-Smirnov test in the cumulative distribution plot and p = 0.6164 by unpaired Student’s t test in the bar graph. D Sample traces (upper panel) and summary plots for the input-output relationship of AMPA receptor-mediated responses recorded from wild-type (open circles) and Tob-KO (gray circles) mice. Scale bars, 100 pA and 20 ms. **p = 0.0039 by Mann-Whitney U test. E Sample traces (upper panel) and summary plots for the I–V curve of AMPA receptor-mediated responses recorded from wild-type (open circles) and Tob-KO (gray circles) mice. Scale bars, 100 pA and 30 ms. F Sample traces with 50-ms inter-pulse interval (upper panel) and summary plots for paired-pulse ratio of AMPA receptor-mediated responses at 10, 30, 50, 100, 200, and 300 ms inter-pulse intervals recorded from wild-type (open circles) and Tob-KO (gray circles) mice. Scale bars, 100 pA and 50 ms. *p = 0.0139 by by Mann-Whitney U test; ***p < 0.0011 by Two-way ANOVA with Sidak’s multiple comparisons test. G Representative traces of mIPSCs recorded from hippocampal pyramidal neurons of wild-type (WT, left traces) and Tob-KO (KO, right traces) at Vh of -70 mV in the presence of 1 μM tetrodotoxin and 100 μM PTX. Scale bars, 20 pA and 500 ms. H Cumulative distribution plots and summary bar graphs for mIPSC amplitude (inset shows the average of mIPSC amplitude) in CA1 hippocampal pyramidal neurons of wild-type (white column) and Tob-KO (gray column) mice. *p = 0.0120 by unpaired Student’s t test in the bar graph. I Cumulative distribution plots and summary bar graphs for the mIPSC inter-event interval (inset shows the average of mIPSC frequency) in CA1 hippocampal pyramidal neurons of wild-type (white column) and Tob-KO (gray column) mice. p = 0.9311 by Kolmogorov-Smirnov test in the cumulative distribution plot and p = 0.1633 by unpaired Student’s t test in the bar graph. J Representative traces of evoked EPSCs at Vh = -60 mV and evoked IPSCs at Vh = 0 mV in wild-type (left) and Tob-KO (right) mice. Scale bars, 50 pA and 30 ms. K Amplitudes of evoked EPSCs at Vh of -60 mV and evoked IPSCs at Vh of 0 mV at each of individual recorded WT and Tob-KO hippocampal pyramidal neurons. L Average excitation/inhibition ratio from WT (open column) and Tob-KO (gray column). *p = 0.0343 by unpaired Student’s t test. Data are expressed as means ± SEMs. Total numbers of cells recorded/total numbers of mice used are indicated in parentheses.

