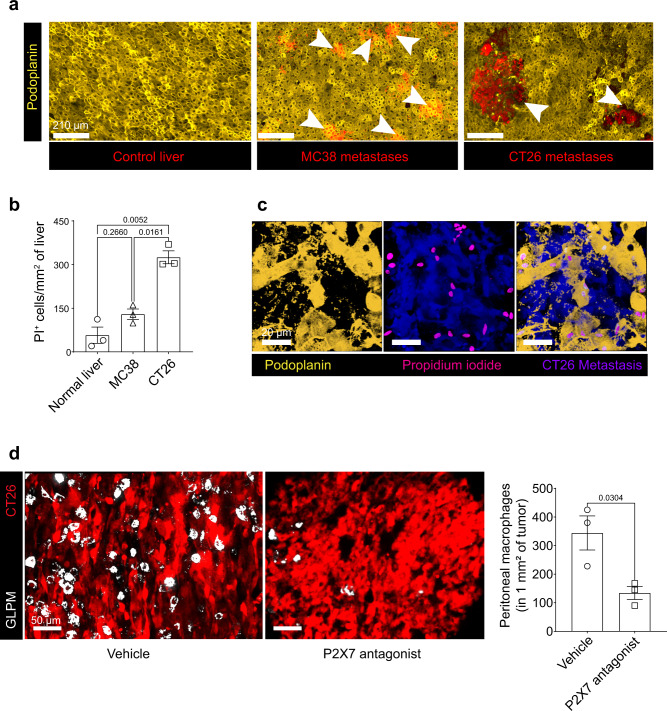
Fig. 3. Mesothelium damage is required for GLPM recruitment to liver metastases.
a Representative intravital images of the liver mesothelium (yellow) in control, MC38 or CT26 metastases (red; white arrows) (scale bar = 210 μm) (n = 5 per group; from two independent experiments). b Quantification of PI+ cells from normal, MC38 or CT26 liver (n = 3 mice per group; from one experiment), P values were calculated using ordinary two-way ANOVA with Tukey’s multiple comparisons test, P = 0.2660 normal liver vs MC38, P = 0.0052 normal liver vs CT26, P = 0.0161 MC38 vs CT26. c Representative image of colocalization of podoplanin+ (yellow) and PI+ (magenta) cells following CT26 liver metastases (blue) (scale bar = 20 µm) (n = 6; two independent experiments). d Representative intravital images (left; scale bar = 50 μm) and quantification (right) of GLPMs (white) within CT26 liver metastases (red) in mice treated with P2X7 receptor antagonist or vehicle (PBS) (n = 3 mice per group; one experiment), P values were calculated using two-tailed unpaired t test, P = 0.0304. All graphs are presented as mean ± SEM. Source data are provided with this paper.

