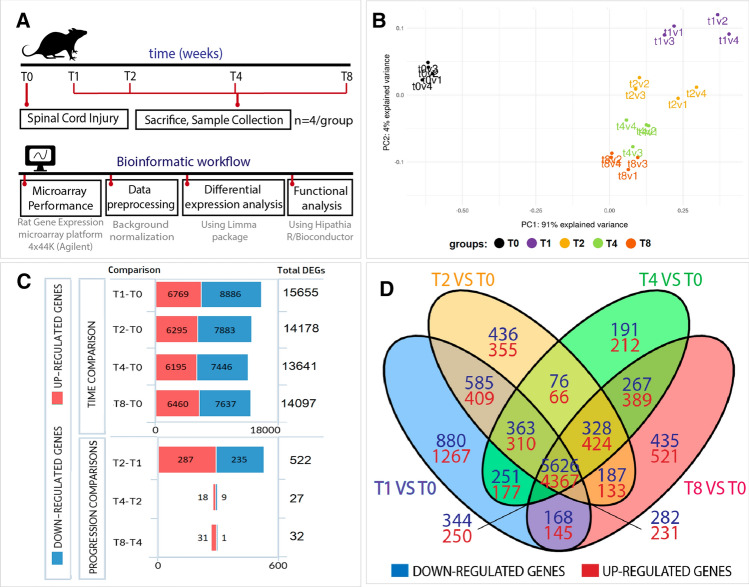
Fig. 1.
Differential expression analysis during SCI evolution. A Schema describing the experimental design, including the in vivo SCI model and the bioinformatic workflow followed in the transcriptional analysis. B Principal component analysis (PCA) of our data set, showing clear segregation between the different experimental groups used to analyse the progression of transcriptional alterations after SCI. Please note that v1, v2, v3, v4 denotes the different biological replicates. C Graphical representation of DEGs from the indicated comparisons during SCI evolution (genes considered differentially expressed with corrected p-values of < 0.05). D Venn diagram depicts DEGs for each time point versus the uninjured spinal cord (T0) and overlapping DEGs between comparisons

