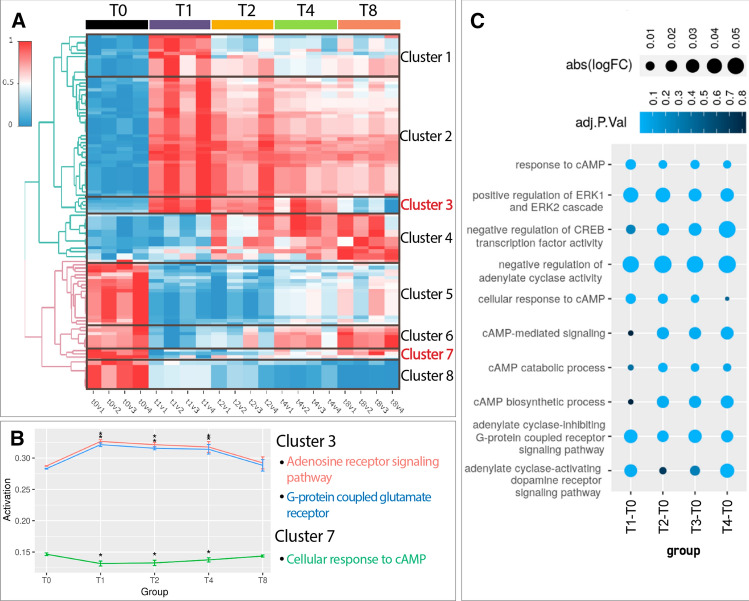
Fig. 2.
Functional analysis during SCI evolution. A Heatmap representing the activation level computed by Hipathia algorithm of differentially activated GO functions for the comparisons on weeks 1, 2, 4, and 8 after SCI relative to the uninjured spinal cord (T0). Red, upregulation; blue, downregulation; v1–v4 indicates replicates for each condition. B Graphical representation of the mean activation levels and associated standard deviation for selected functions encountered in clusters 3 and 7 (*, adjusted p-value < 0.05). C Dot plot depicting significantly altered cAMP-related GO terms after SCI. Colour intensity represents the corresponding adjusted p-value, while dot size indicates the logFC

