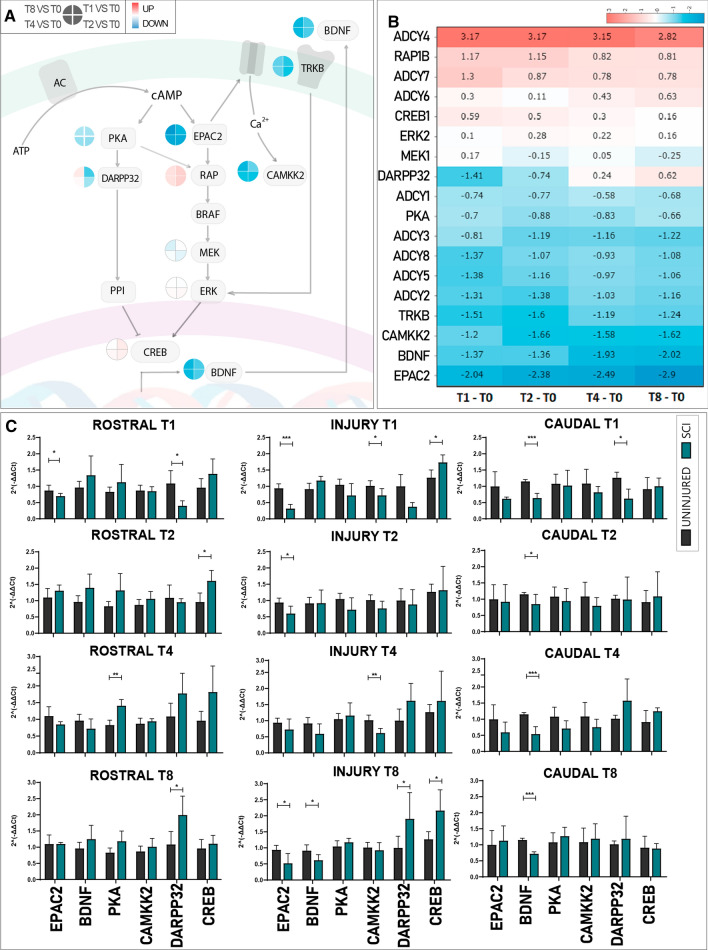
Fig. 3.
qPCR-mediated Confirmation of transcriptional alterations to the cAMP signalling pathway after SCI. A Schematic representation of the cAMP pathway depicting relevant components. The clock icon next to each component represents the evolution of gene expression alterations (from 1 week [T1] to 8 weeks [T8]) as indicated in the legend. B Heatmap of cAMP signalling pathway genes showing logFC for each gene over time. Red, upregulation; Blue, downregulation. C Microarray expression data validation by qPCR-mediated assessment of gene expression of cAMP-related genes for evolution (from top to bottom) and tissue localization (from left to right) in uninjured spinal cord/control (Black) versus SCI (Green). Data shown as mean ± SEM. Each gene independently assessed for normality using the Shapiro–Wilk test and then analysed using a one-tailed unpaired t-student; *p < 0.05, **p < 0.01, ***p < 0.001

