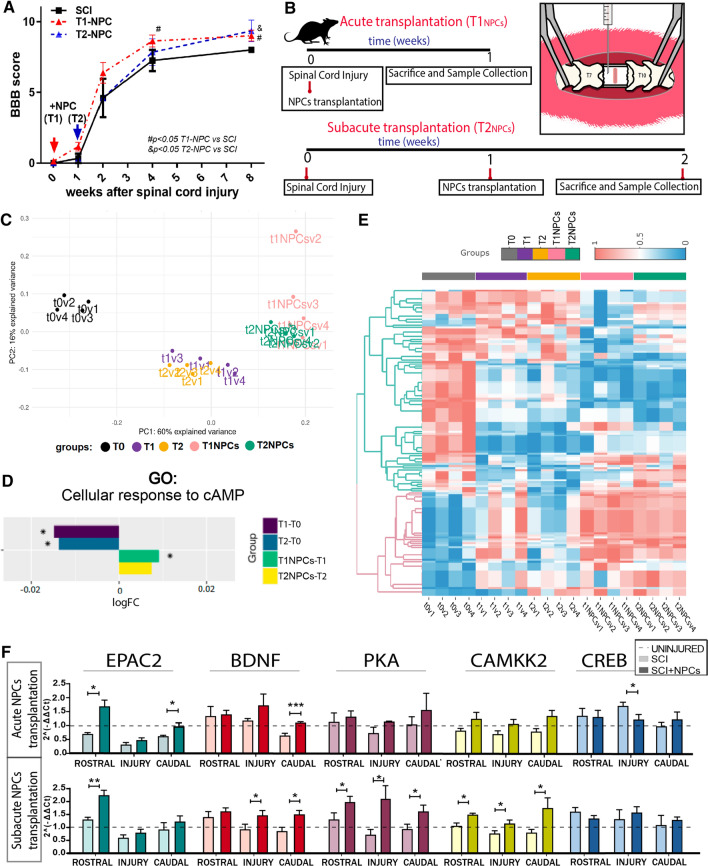
Fig. 4.
Transcriptional profile analysis after acute/subacute NPC transplantation and analysis of transcriptional changes in cAMP-related genes. A Functional locomotor evaluation by open-field BBB scale over 8 weeks post-SCI and after acute or sub-acute NPC transplantation (parallel animals to those used for the microarray analysis). Data expressed as mean ± S.E.M., determined by two-way mixed model ANOVA with Tukey's multiple comparison test (#p < 0.05 T1-NPC versus SCI; &p < 0.05 T2-NPC versus SCI) (n = 6 animals). B Schema describing the in vivo experimental design. C Principal component analysis (PCA) of our data set, showing clear segregation between the different experimental groups used to analyse the impact of NPC transplantation on SCI-induced transcriptional alterations; v1–v4 indicates replicates for each condition. D Bar-graph representing logFC regarding cellular responses to cAMP for indicated comparisons, showing that NPC transplantation reverses the SCI-induced downregulation in this biological function. E Heatmap representing differentially-activated GO functions computed by the Hipathia algorithm, which provided significant results between uninjured (dark grey), injured at week 1 (T1—purple) or week 2 (T2—orange), acute (pink), and subacute (green) NPC transplantation; v1-v4 indicates replicates for each condition (interactive version at Online Resource File 1) F qPCR analysis of cAMP-related genes after acute (upper row) and subacute (bottom row) NPC transplantation. Data shown as mean ± SEM, evaluated with the Shapiro–Wilk test to assess normality and one-tailed unpaired t-student or Mann–Whitney test to compare groups: *p < 0,05, **p < 0.01, ***p < 0.001

