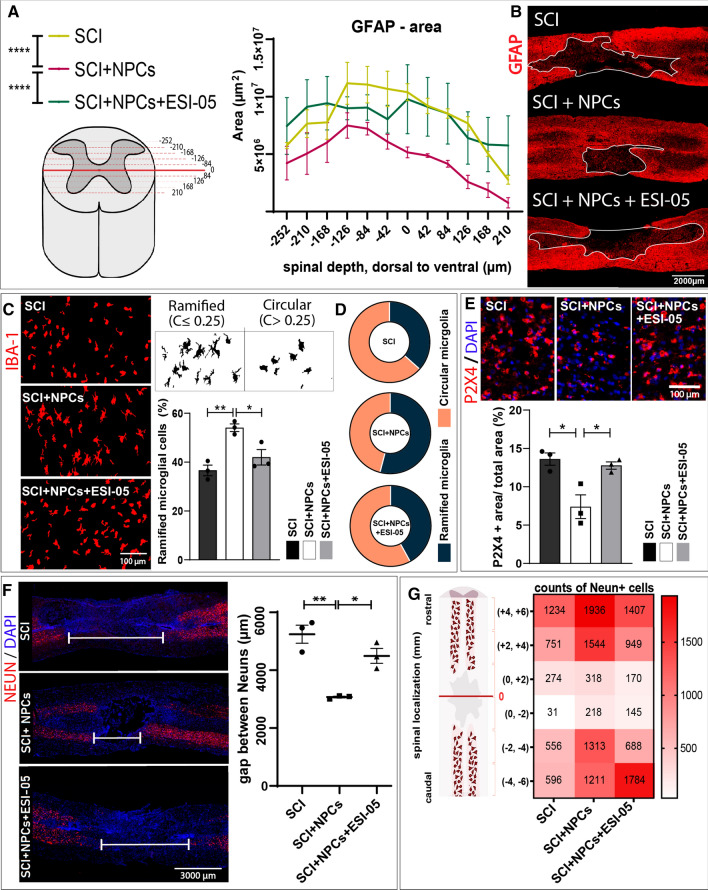
Fig. 6.
Effects of dual NPC and ESI-05 treatment on scar area, microglial phenotype, and NeuN + cell gap. A Quantification of the scar area (GFAP-) throughout longitudinal slices in the mid-region of the injured spinal cord. Two-way ANOVA: ****p < 0.0001. B Representative images of GFAP immunostaining and traced GFAP- area (white line). C Morphological visualization of microglial cells by Iba-1 staining and determination of the percentage of ramified microglial cells. D Pie charts representing the microglial population segregated in ramified or circular cells for each experimental group. E Representative images of P2X4 immunostaining and its quantification. One-way ANOVA: *p < 0.05. F Representative images (left panel) of the sparsity of NeuN + cells through the injury and quantification of the gap distance (right panel). G Heat map showing the mean number of NeuN + cells per experimental group in each spinal segment of 2 mm

