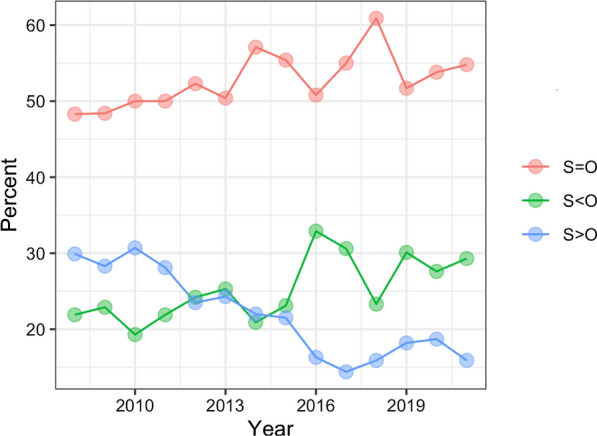
Fig. 1.

Concordance between subjective and objective assessments of AD severity by year. The figure depicts the proportion of clinical notes that were S = O, S < O, and S > O in each year over the 12-year study period (2008–2021). S = O, subjective and objective severity assessments agreed (red); S < O, subjective assessment was less severe than objective assessment (green); S > O, subjective assessment was more severe than objective assessment (blue)
