Figure 7.
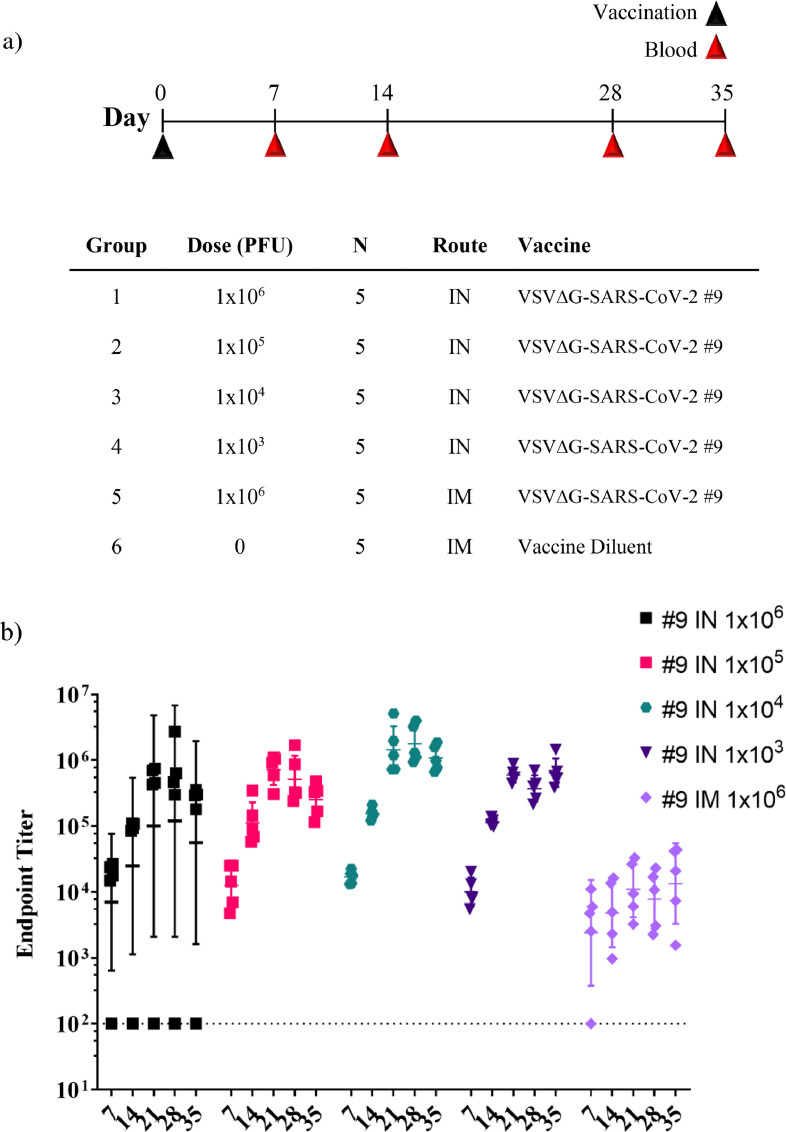
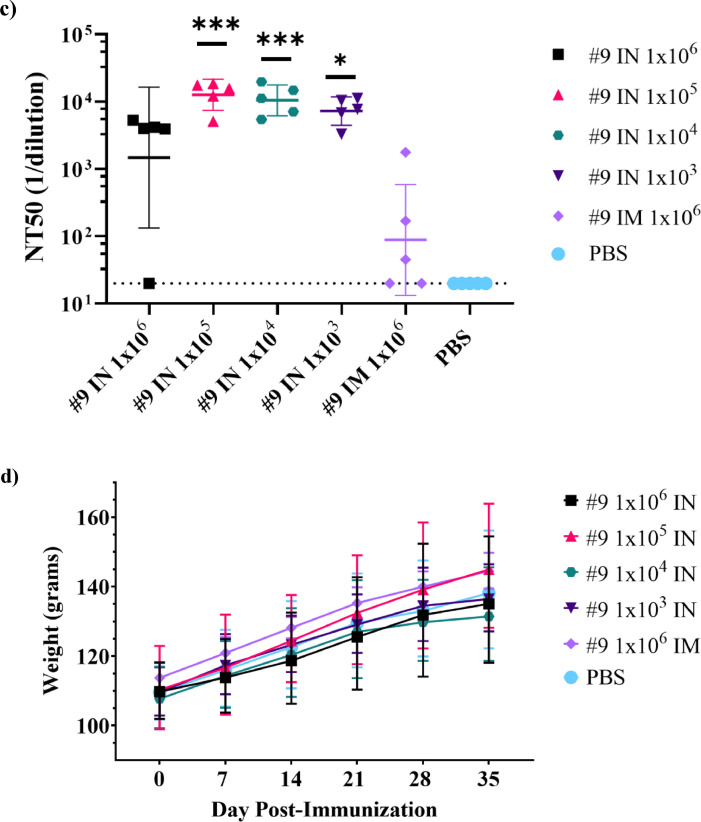
Immunogenicity of intranasal VSVΔG-SARS-CoV-2 vaccination in hamsters. (a) Design of the hamster IN immunogenicity dose-range study. Four groups of five animals were immunised with a single IN inoculation of VSV∆G-SARS-CoV-2 #9 using the indicated dose. As a comparator, a group of five animals were immunised with a single IM injection in one hind leg using the highest dose (1 × 10⁶ PFUs) used in the earlier studies (Figures 3 and 5). Blood samples were collected on days 0, 7, 14, 28, and 35 and serum IgG titres were analysed using ELISA plates coated with soluble Spike (b) and neutralising antibody titres (c) were quantified by plaque reduction assay using VSV∆G-SARS-CoV-2 #9 and sera from day 28. (d) Hamster weights also were monitored weekly. The data is plotted as geometric mean with geometric SD. Dashed lines indicate lower limit of assay detection for the ELISA Endpoint Titre (LOD 100) and neutralisation assay (LOD 20). Statistical analysis was performed for the ELISA (b) and neutralisation assay (c) by comparing vaccine cohort values to negative control assays conducted with PBS using a two-way ANOVA multiple comparison with Dunnett correction. For the ELISA values (b) there was no significant difference between the intranasal groups so symbols indicating significance are omitted for clarity. Similarly, hamster weights were not significantly different between groups and symbols indicating significance are omitted. IM, intramuscular; IN, intranasal; LOD, limit of detection; NT50, NT50, neutralising titres that reduced plaques by 50%; OM, oral mucosa; PBS, phosphate-buffered saline; PFU, plaque-forming units. (n = 5, *p ≤ 0·05, **p ≤ 0·005, ***p ≤ 0·0001).


