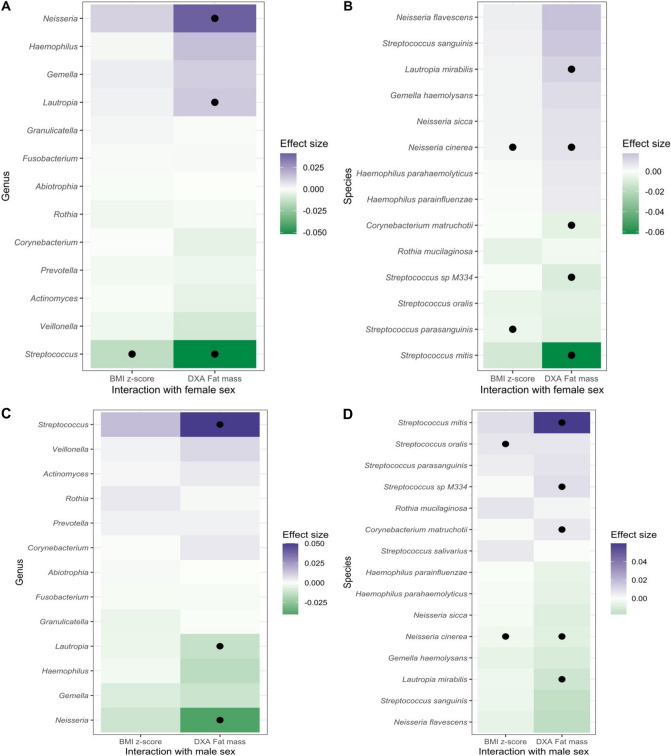
Figure 4.
Assessing the joint effects of body mass and sex on saliva microbiota at 3 or 4 years of age. MaAsLin2 models included in addition to the interaction term: the growth variable, sex (male or female), delivery mode (vaginal or cesarean), sample age in days, maternal BMI, gestational age in weeks, and solid foods start age in months. Black circles indicate a p-value < 0.1. (A) Coefficient for interaction between female sex and child growth metric (age and sex adjusted BMI z-score or total fat mass in grams using a DXA scan) on the relative abundance of genera. (B) Coefficient for the interaction between female sex and child growth metrics on the relative abundance of species. (C) and (D) use the same data but the models for the interaction term represents joint effects with males instead of females. For species, only associations with an effect size > 0.005 or < − 0.005 are included.

