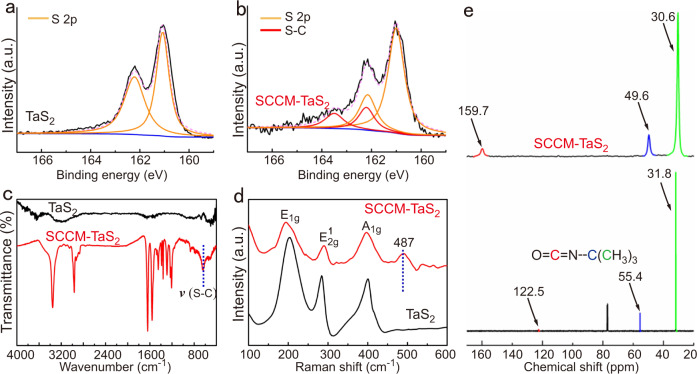
Fig. 3. Chemical and spectral characterization from the pristine TaS2 and SCCM-TaS2 hybrid structure.
XPS of S 2p regions from the pristine TaS2 single crystals (a) and SCCM-TaS2 hybrid structure (b). c FTIR spectrum of pristine TaS2 single crystal and SCCM-TaS2 hybrid structure. d Raman spectrum of pristine TaS2 single crystal and SCCM-TaS2 hybrid structure. e Liquid-state 13C NMR spectrum of tert-Butyl isocyanate (below) and solid-state 13C NMR spectrum of SCCM-TaS2 hybrid structure (above).

