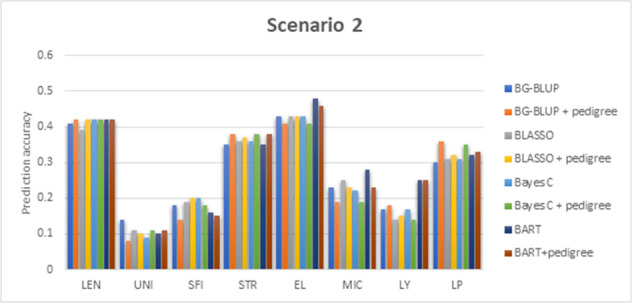
Fig. 2. The prediction accuracies of the scenario 2: the lines phenotyped at seasons 1993–2016 were used as the training population, and the data collected in the 2017/2018 season were used as the test population.

Methods under evaluation were Bayesian G-BLUP, Bayesian LASSO, Bayes C, BART, and these three models further adding pedigree or structure information as random effects, and BART. Traits being analysed included fibre length (LEN), uniformity (UNI), short fibre index (SFI), fibre strength (STR), fibre elongation (EL), fibre micronaire (MIC), lint yield (LY) and lint percentage (LP).
