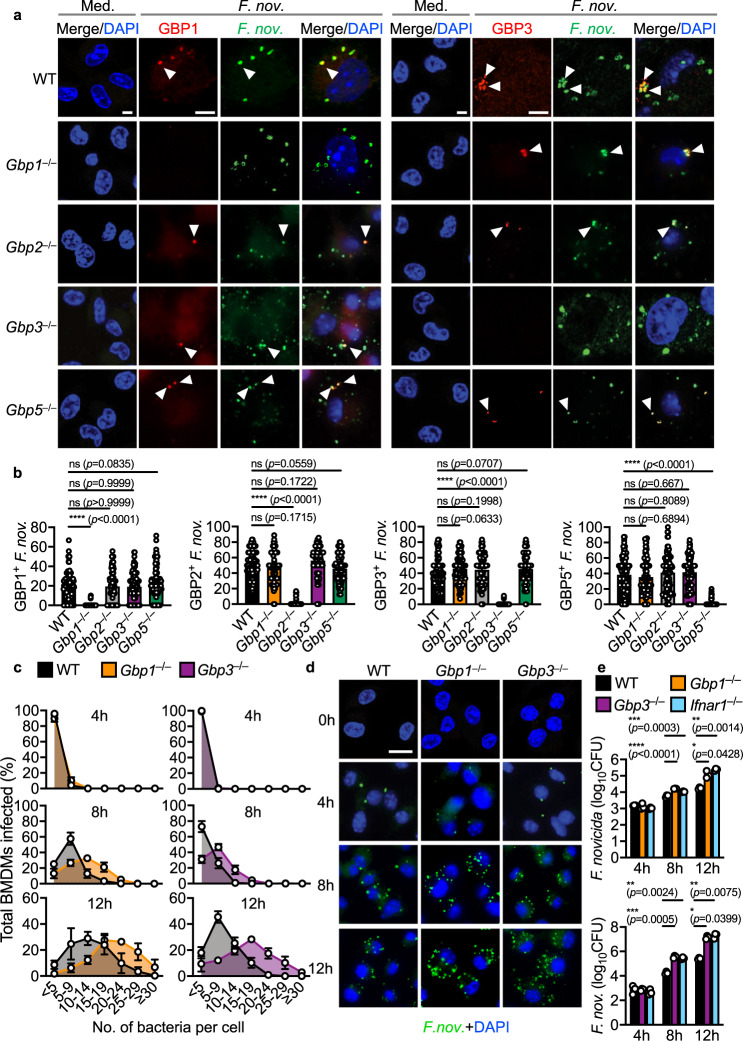
Fig. 2. GBP1 and GBP3 target intracellular F. novicida and restrict its growth.
a Confocal microscopy analysis of F. novicida (green) and GBP1 (red) or GBP3 (red) in WT, Gbp1–/–, Gbp2–/–, Gbp3–/– and Gbp5–/– BMDMs left untreated (Med.) or assessed 20 h after infection with F. novicida (MOI 20). White arrows indicate bacteria colocalized with GBP. b Quantitation of GBP1-, GBP2-, GBP3-, GBP5-positive F. novicida in WT, Gbp1–/–, Gbp2–/–, Gbp3–/– and Gbp5–/– BMDMs as treated in a. c The percentages of WT and Gbp1–/– BMDMs (left) or WT and Gbp3–/– BMDMs (right) harboring different number of bacteria. d Confocal microscopy analysis of F. novicida (green) and DNA (blue) in WT, Gbp1–/– and Gbp3–/– BMDMs 0, 4, 8, and 12 h after infection with F. novicida (MOI 25). e Recovery of F. novicida (as colony-forming units (CFU)) from WT, Gbp1–/–, Gbp3–/– and Ifnar1–/– BMDMs at 4, 8, or 12 h after infection with F. novicida (MOI 50). Scale bars, 7 µm (a) and 20 µm (d). ns no statistical significance; *P < 0.05, **P < 0.01; ***P < 0.001, ****P < 0.0001 (one-way ANOVA with Dunnett’s multiple-comparisons test (b, e)). Data are from one experiment representative of three independent experiments (a, d) or pooled from three independent experiments (b, c, and e, mean and s.e.m. in b, c, and e). Source data are provided as a Source data file.

