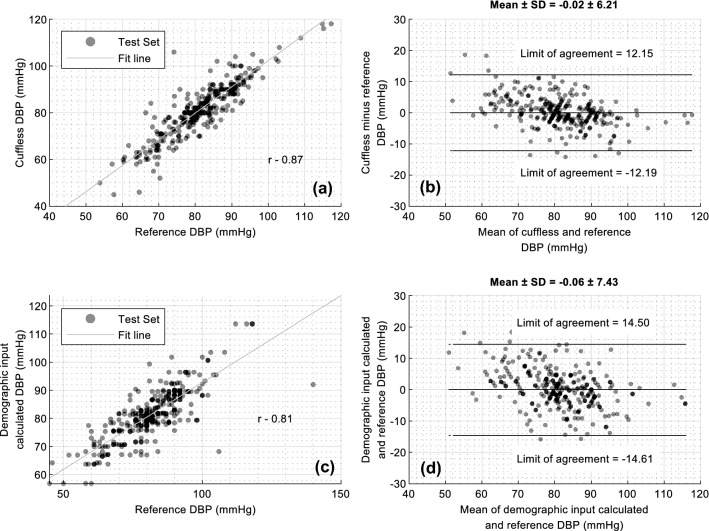
Figure 8.
Comparison of actual and predicted measures of Diastolic blood pressures from the SimpleSense-BP cuffless model and a baseline model that uses only demographics data. (a) scatter plot of predicted vs actual SBP for test set only for SimpleSense-BP device with the correlation coefficient (b) Bland Altman plot for test set with limits of agreement and the mean and standard deviation of errors compared to the reference measurement (c) scatter plot of predicted vs actual SBP on test set only for baseline model (d) Bland Altman plot on test set only with limits of agreement and the mean and standard deviation of errors compared to the reference measurement for the baseline model.

