
Figure 1.
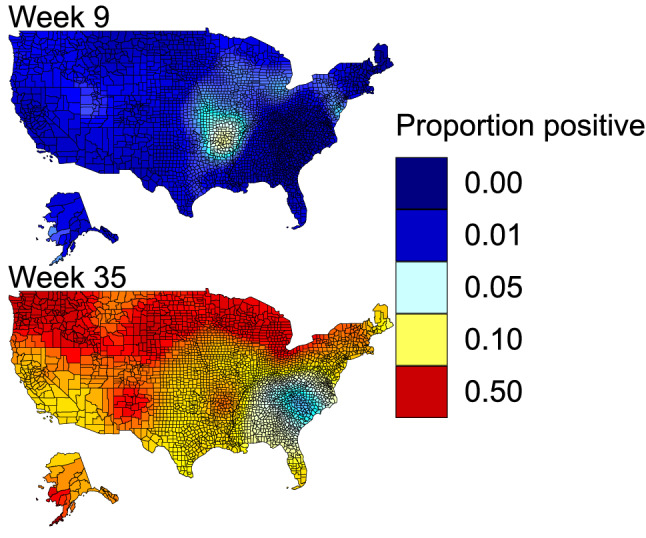
Example of spatiotemporal predictions of IAV prevalence in mallards. The listed weeks roughly correspond to the first week of March and September, highlighting the low levels of IAV prevalence in Spring outside of a relative hot-spot in the Mississippi Alluvial Valley, as well as the wide-spread elevated prevalence in fall across the northern latitudes. Maps were produced in ggplot268. Full predictions for all species and week combinations are available in Supplementary Material 2.