
Fig. 1. Sex chromosome system distribution among plants and animals.
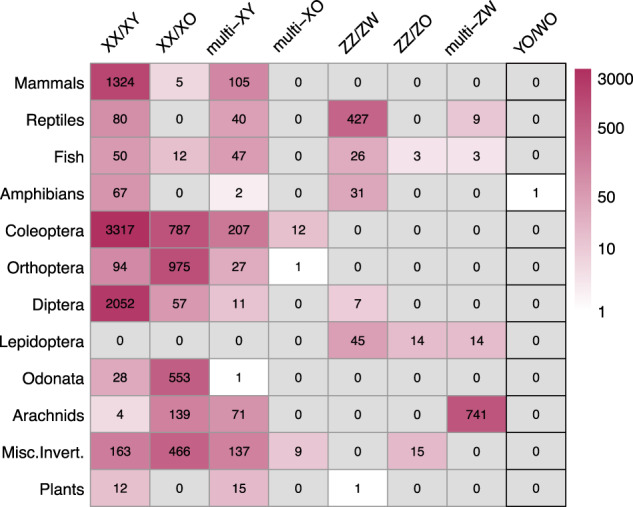
Each cell shows the number of species with a given sex chromosome system. The hue of each cell is based on a log scaling of the count number. Data obtained for this figure were downloaded through open access databases and data included in the following manuscripts: mammals, reptiles, fish, and plants (Tree of Sex Consortium 2014), amphibians (Perkins et al. 2019), Orthoptera (Sylvester et al. 2020), Diptera, Lepidoptera, Odonata, and Coleoptera (Blackmon et al. 2017), arachnids (Araujo et al. 2021, Schneider et al. 2021, Tsurusaki et al. 2021), and misc. invert. (Blackmon et al. 2017).