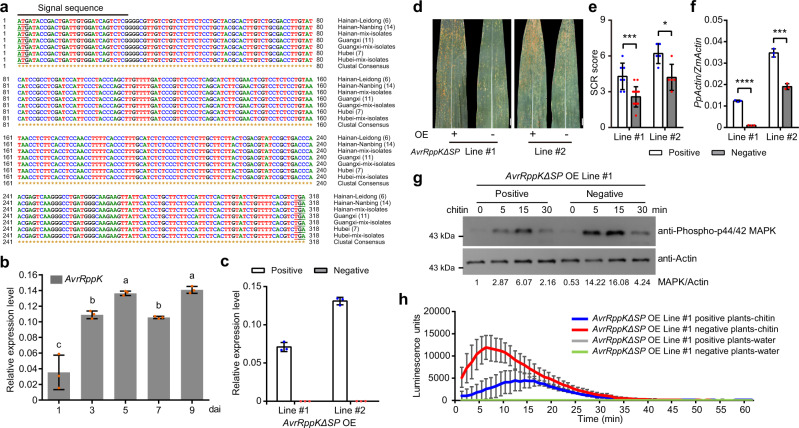
Fig. 4. AvrRppK suppresses chitin-triggered immunity.
a The AvrRppK gene is conserved in all tested P. polysora field isolates. DNA samples were isolated from twenty P. polysora isolates from Hainan, eleven isolates from Guangxi, six isolates from Hubei and mixed spores collected from Hainan, Guangxi and Hubei, respectively; b The expression level of AvrRppK during infection. Five-leaf stage B73 plants were inoculated with conidia of the P. polysora Wuhan strain. Leaf samples taken at 1, 3, 5, 7, and 9 days after inoculation (dai) were used for RT-qPCR to evaluate the expression levels of AvrRppK relative to those of the P. polysora Actin gene. Values are means ± SDs (n = 3 repeats). One-way ANOVA with Fisher’s LSD test (mean ± SD; n = 3, biologically independent samples). Different letters indicate significant differences at P < 0.05. c The transcription levels of AvrRppKΔSP measured by RT-qPCR in two independent transgenic maize lines overexpressing AvrRppKΔSP (n = 3). d The SCR disease phenotypes of two independent transgenic maize lines overexpressing AvrRppKΔSP. “+” means transgenic-positive plants, “-” means transgenic-negative plants. e The SCR disease scores of two independent transgenic maize lines overexpressing AvrRppKΔSP (n = 7, 14, 5, 5). f The fungal biomass accumulation in two independent transgenic maize lines overexpressing AvrRppKΔSP was measured by RT-qPCR amplification of the P. polysora Actin gene relative to the Zea mays Actin gene (n = 3). g The chitin-triggered MAP kinase activity was suppressed by AvrRppK. Western blot was used to detect MAP kinase activity by anti-Phospho-p44/42 MAPK antibody (dilution 1:1000). The loading control was maize Actin proteins measured by western blot using anti-Actin antibody (dilution 1:5000). Relative MAP kinase activity was normalized to the level of Actin protein. h Chitin-induced ROS accumulation was suppressed by AvrRppK. The absolute luminescence was used to represent ROS accumulation (for each time point, n = 6). Water treatment was taken as the control. For c–h, values are means ± SDs; *P < 0.05, ***P < 0.001, ****P < 0.0001 (two-tailed Student’s t-test). These experiments were repeated three times with the similar results. Source data are provided as a Source Data file.

