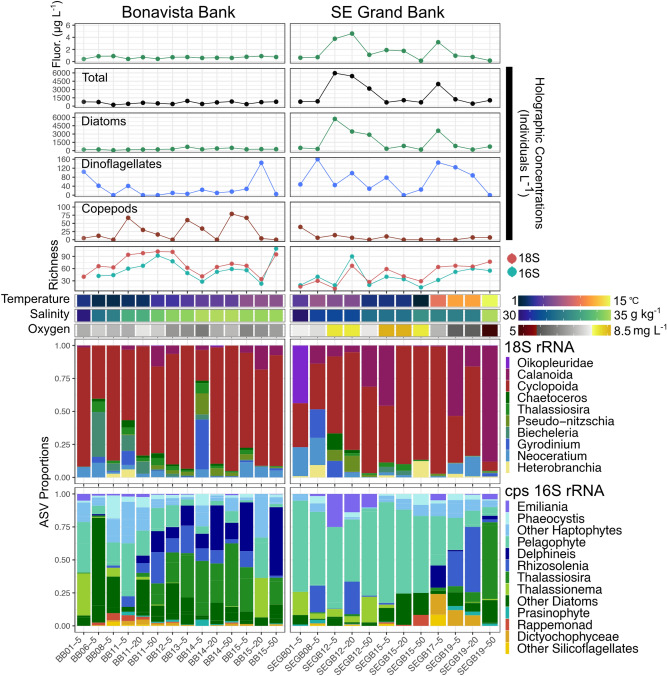
Figure 2.
The full set of observations for both transects including chlorophyll-a fluorescence (Fluor.), imaging concentrations, ASV richness, physicochemical data (temperature, salinity, oxygen) and the multi-marker taxonomic composition. Richness error bars represent standard errors under the breakaway model. The x-axis is oriented by station order from shore to shelf and depth (5–50 m). Comparing transects reveals a contrast between higher plankton richness and lower abundance on Bonavista Banks and vice versa on the SE Grand Banks. Physical gradients spanning on-shelf to off-shelf water masses are also evident in salinity on the Bonavista Banks and temperature on the SE Grand Banks; however the 18S and 16S taxonomic compositions across these gradients are more complex during the early winter sampling period.

