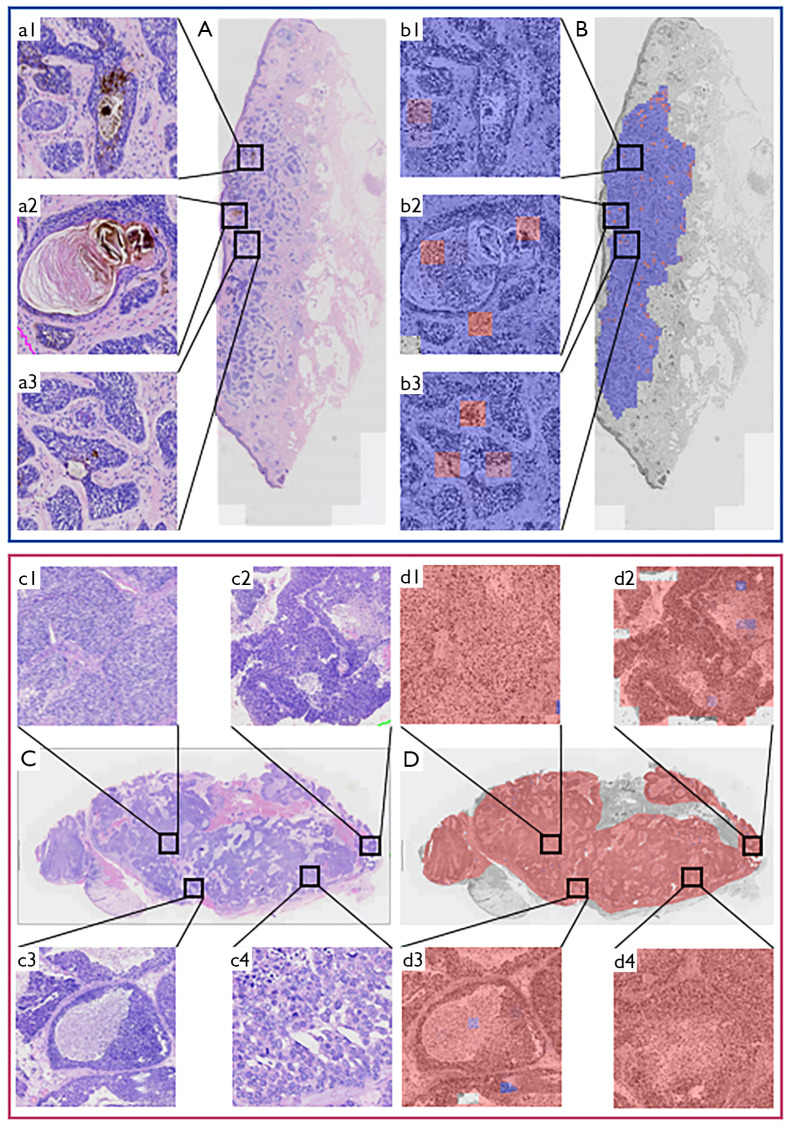
Figure 2.
Visualization of the DL model, using two typical WSIs. (A) WSI for eyelid BCC case. (a1-3) Higher magnification view of A. (B) Visualization of indicative regions in A. (b1-3) Higher magnification view of B, corresponding to a1–3, respectively. (C) WSI for eyelid SC case. (c1-4) Higher magnification view of C. (D) Visualization of indicative regions in C. (d1-4) Higher magnification view of D, corresponding to c1–4, respectively. Gray area: greyscaled image; blue area: characteristic regions of the histological structures for eyelid BCC; red area: characteristic regions of the histological structures for eyelid SC. Darker colours indicate greater prediction of confidence. DL, deep learning; WSI, whole slide image; BCC, basal cell carcinoma; SC, sebaceous carcinoma.

