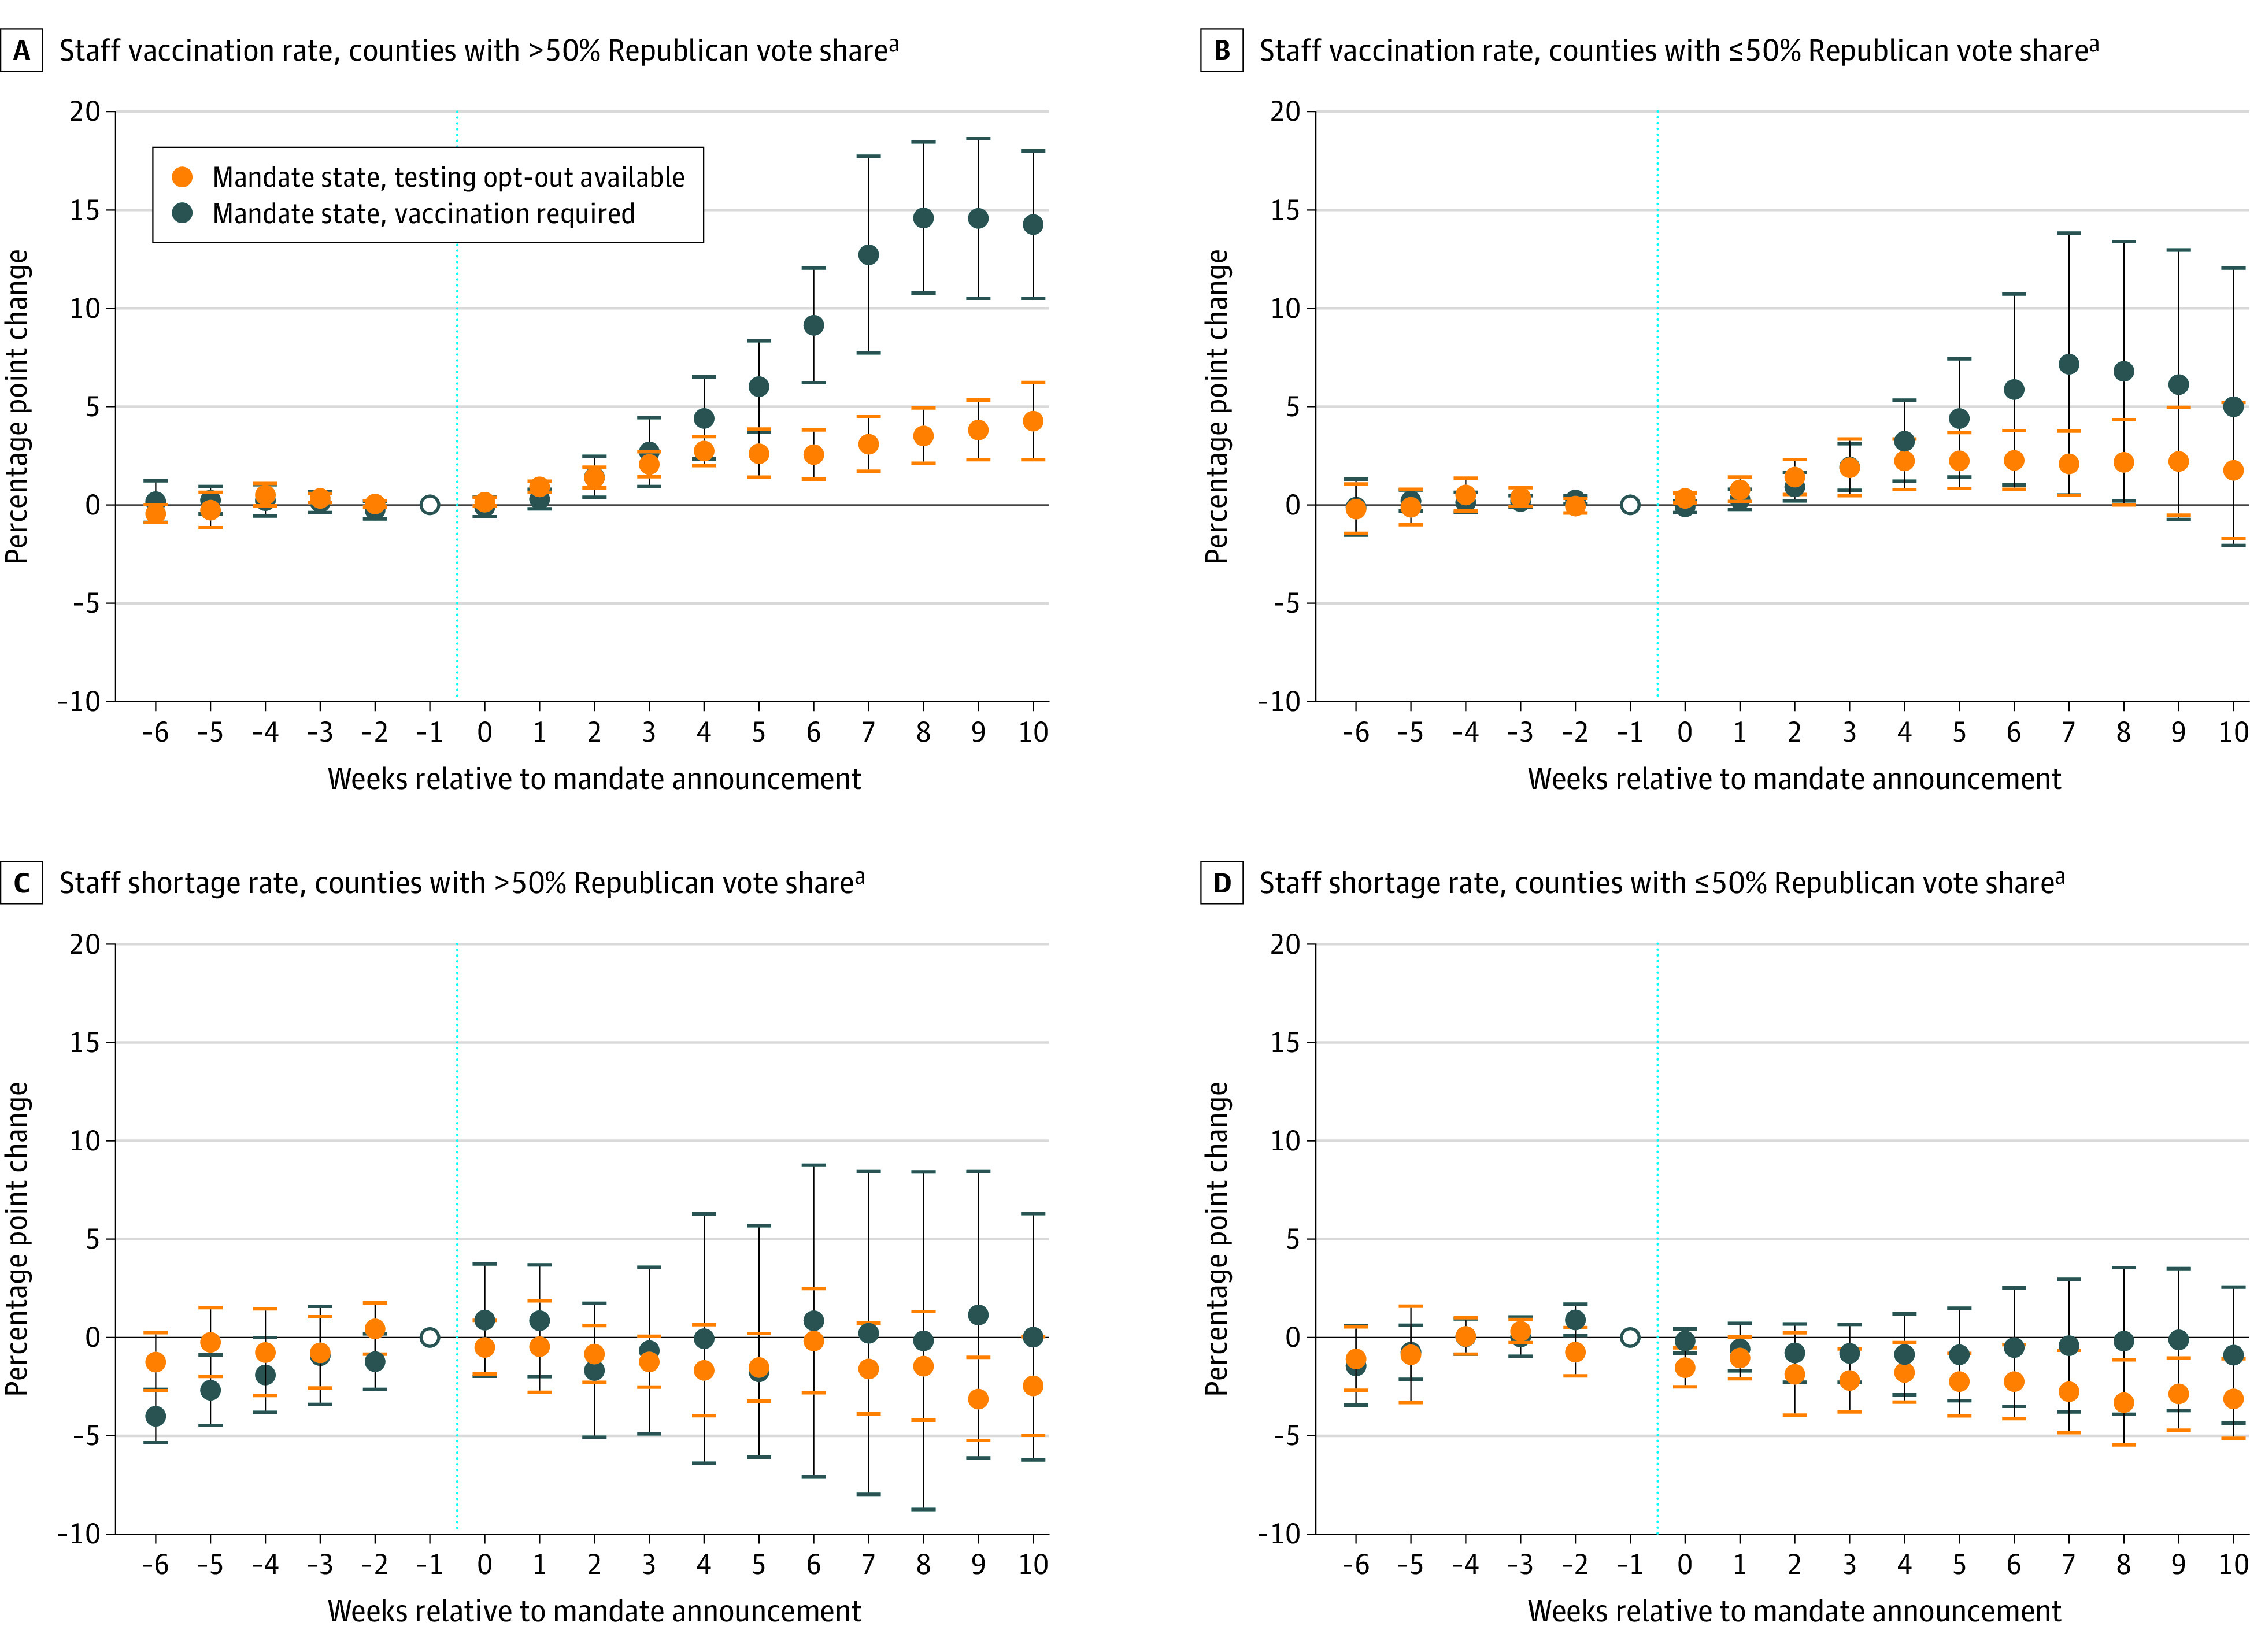
Figure 3. Nursing Home Staff Vaccination Coverage and Reported Staff Shortages After Mandate Announcement, by Mandate Type and County Voting Patterns.

aDefined as the share of votes for the Republican presidential candidate in the 2020 election.
Figure plots estimated weekly differences and 95% CIs in staff vaccination coverage (A and C) and reported staff shortage rates (B and D) by county political preference between mandate states (with and without a test-out option) and nonmandate states following mandate announcement (denoted by the vertical dashed line). Estimates are obtained from an event study regression with facility and separate calendar week fixed effects for Republican- and Democratic-leaning counties. Full details are available in eAppendix 2 in the Supplement. Event week = −6 contains estimates for event weeks ≤ −6. Event week = 10 contains estimates for event weeks ≥10.
