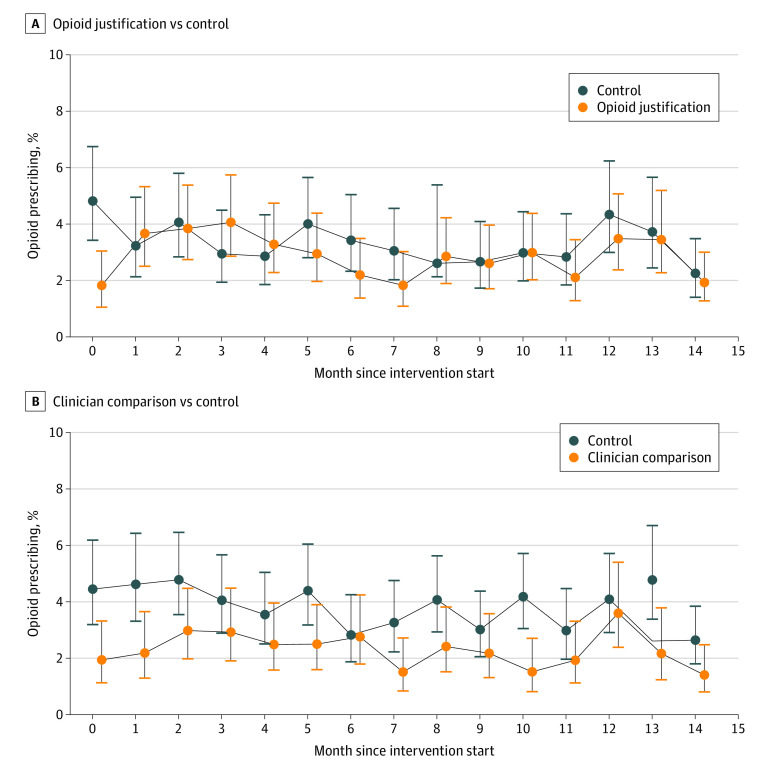
Figure 2. Rate of Opioid Prescribing at the Qualifying Clinic Visit.
A, Opioid justification vs control. B, Clinician comparison vs control. The figure shows opioid prescribing rates by month during the 15-month intervention phase of the trial. Month 0 is when interventions were initiated at the participating practices. The vertical lines indicate 95% CIs. Opioid justification includes participants from the justification and justification/comparison groups. Clinician comparison includes participants from the comparison and justification/comparison groups.

