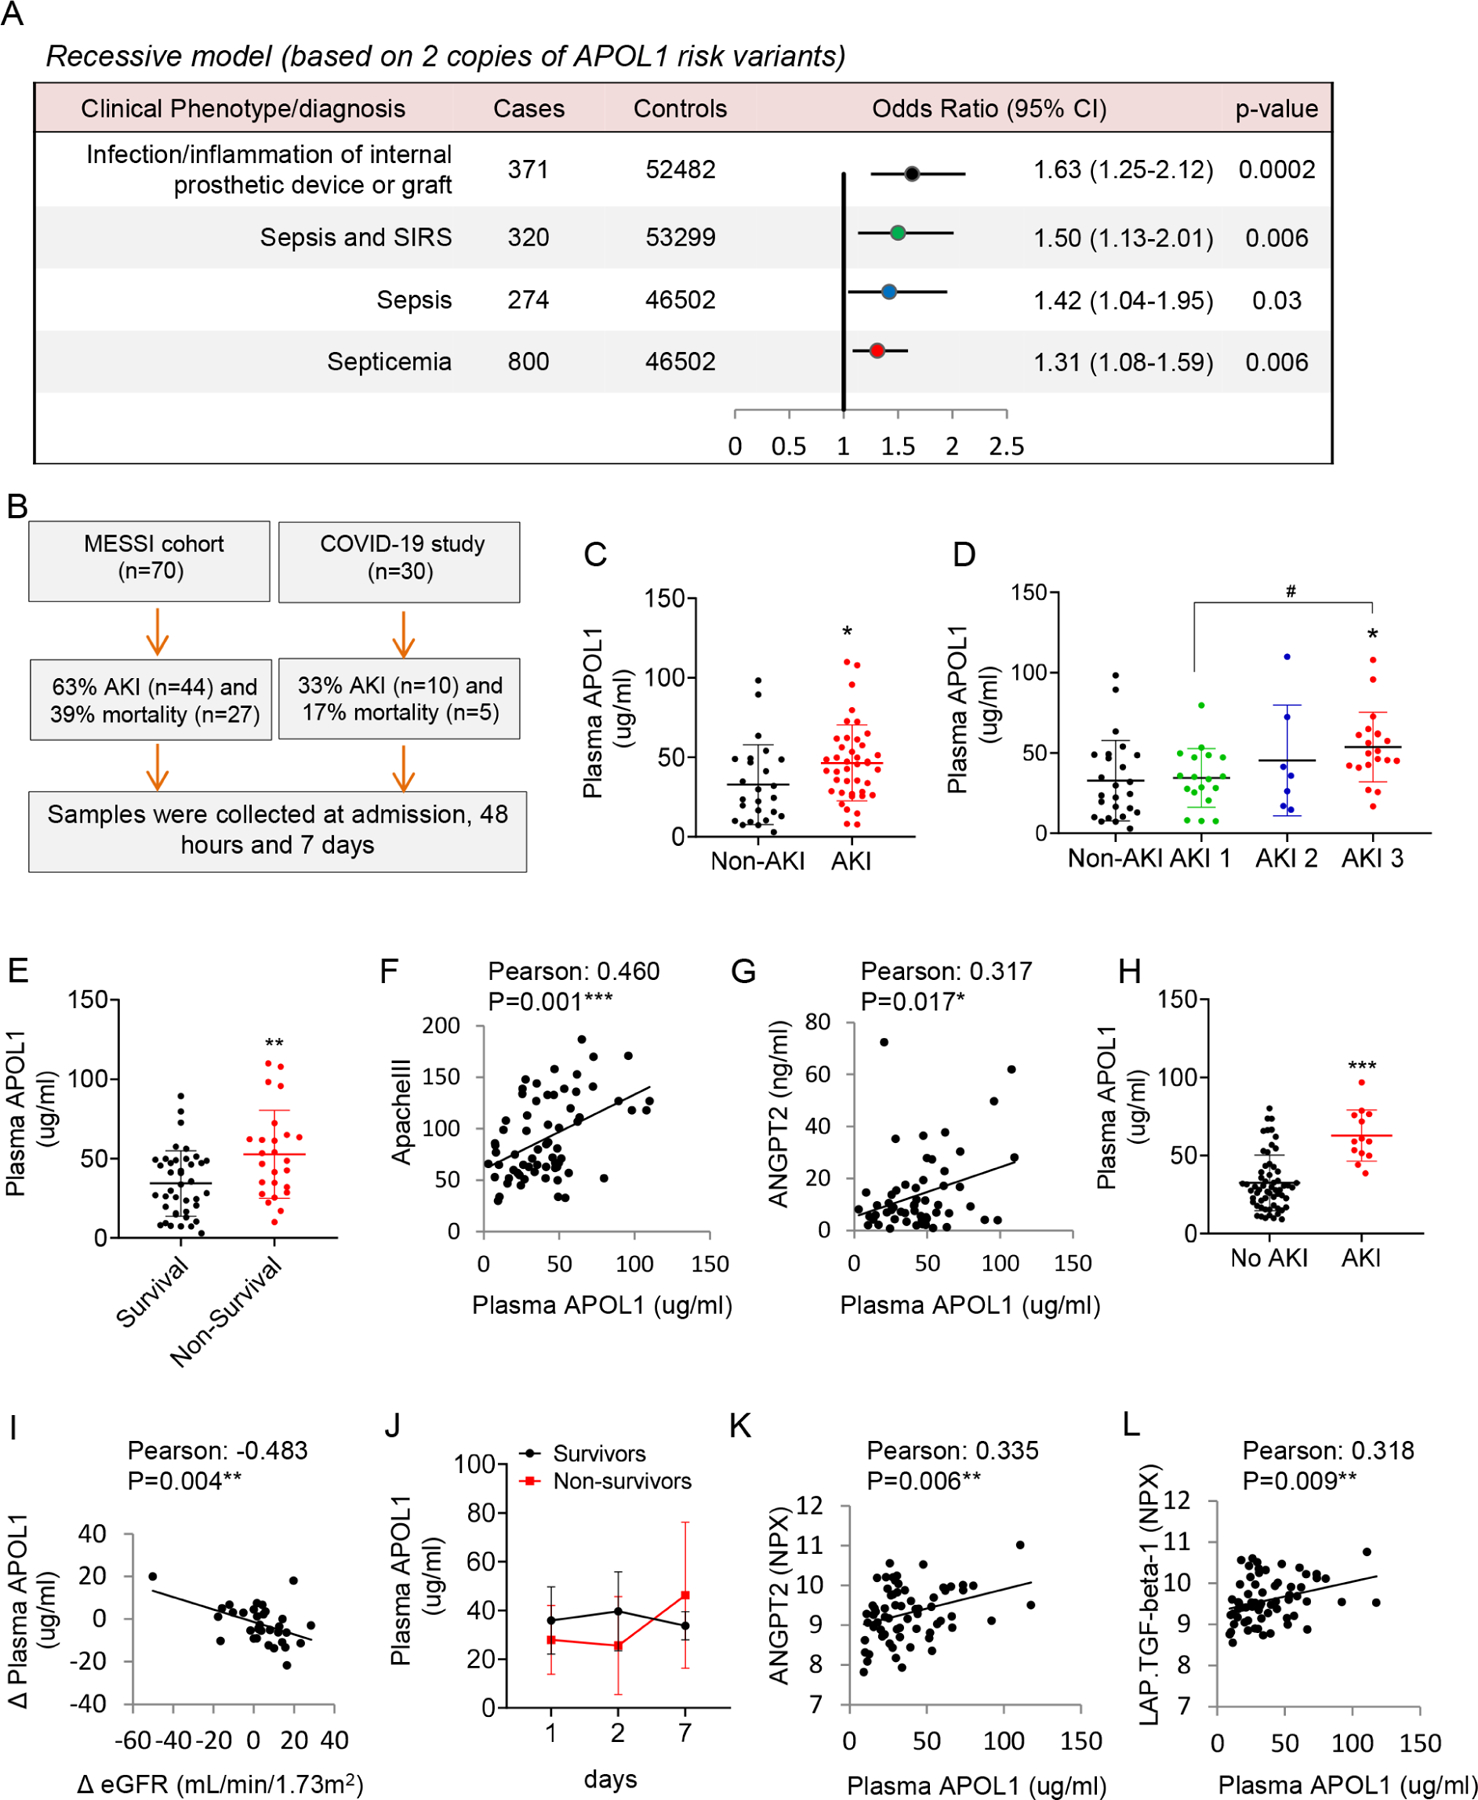
Figure 1. Association of APOL1 risk genotypes, plasma APOL1 levels with sepsis and COVID19 severity.

A. Association between APOL1 risk alleles and Systemic infections/Sepsis phenotypes in the MVP cohort. A recessive model was used to estimated odds ratios (ORs) and 95% CIs. All analyses were adjusted for age and sex and 10 principal components of ancestry.
B. Study flow-chart, showing AKI incidence and mortality. We enrolled n=70 participants with sepsis in the MESSI cohort (C-G) and n=30 in the COVID19 (H-L) cohorts.
C. Plasma APOL1 levels (at presentation) (y-axis) in non-AKI and AKI patients in the MESSI cohort. *p<0.05.
D. Plasma APOL1 levels (at presentation) in non-AKI, AKI stage 1 (AKI 1), AKI stage 2 (AKI 2), and AKI stage 3 (AKI 3) patients. *p<0.05 vs Non-AKI; #p < 0.05 vs. indicated group.
E. Plasma APOL1 levels in surviving and non-surviving patients at presentation. **p<0.01.
F. The correlation of plasma APOL1 levels at presentation and ApacheIII score.
G. The correlation of plasma APOL1 levels at presentation and ANGPT2.
H. Plasma APOL1 levels in participants with and without AKI in the COVID19 study. ***p<0.001.
I. The correlation of change in plasma APOL1 level (Δ APOL1) (the increase in APOL1 from admission to day 2, day 7 and day 28) with change in eGFR (Δ eGFR) (between previous measurements).
J. Plasma APOL1 levels on day 1, 2, and 7 in survivors (N=12) and non-survivors (N=6).
K. The correlation of plasma APOL1 and ANGPT2 levels in the COVID19 cohort. NPX: Normalized Protein expression.
L. The correlation of plasma APOL1 and LAP.TGF.beta-1 levels in the COVID19 cohort
