
Figure 6. Mitophagy defect in RV APOL1 ECs causes cytosolic mtDNA leakage and inflammasome and STING activation leading to an inflammatory, pro-adhesive endothelial phenotype.
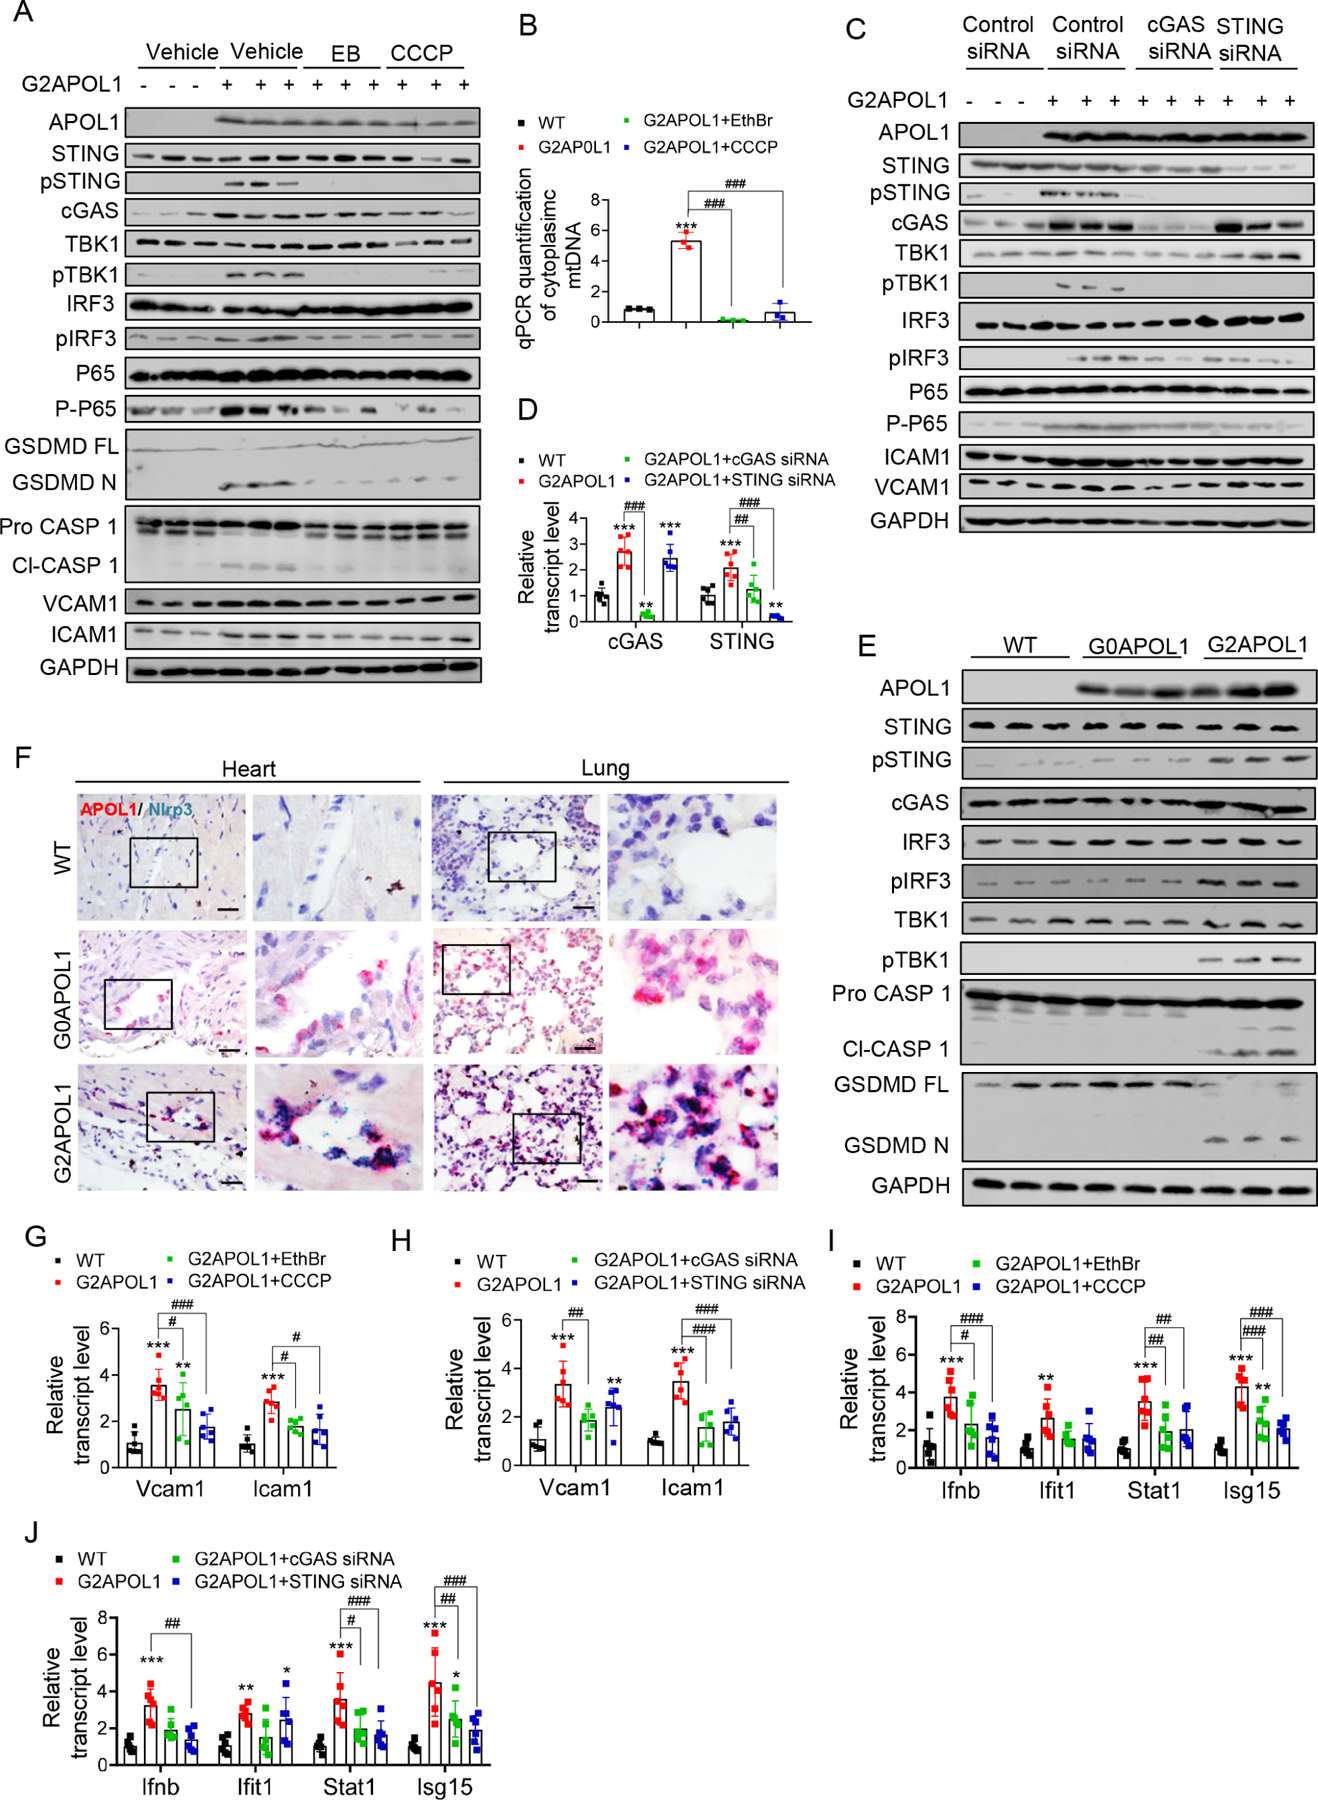
A. Protein expression of APOL1, VCAM1, ICAM1, inflammasome and cytosolic nucleotide sensors (STING, pSTING, cGAS, TBK1, pTBK1, IRF3, pIRF3, P65, P-P65, GSDMD and Caspase 1) were analysed on immunoblots in WT, and G2APOL1 ECs treated with Vehicle, ethidium bromide (EthBr) (150ng/ml 48hours), or CCCP (40uM, 2hours).
B. Total DNA was harvested from cytosolic and nuclear fractions of WT or G2APOL1 ECs treated as (A) and analysed by qRT-PCR. Cytosolic mtDNA genes were normalized to respective nuclear Rpl13a; ***p<0.001 vs WT; ###p < 0.001 vs. indicated group.
C. Western blot analysis of APOL1, VCAM1, ICAM1 and cGAS-STING proteins (STING, pSTING, cGAS, TBK1, pTBK1, IRF3, pIRF3) in WT and G2APOL1 ECs treated with vehicle, STING or cGAS siRNA.
D. Relative transcript level of cGAS and STING in WT and G2APOL1 ECs treated as (C). **p<0.01, ***p<0.001 vs WT; ###p < 0.001 vs. indicated group.
E. Immunoblot analysis using antibodies against STING, pSTING, cGAS, TBK1, pTBK1, IRF3, pIRF3, Caspase 1, GSDMD and Actin in lung tissue from WT, EC/G0APOL1 and EC/G2APOL1 mice.
F. Representative images of Nlrp3 (blue) and APOL1 (red) in situ hybridization in heart and lung of WT, EC/G0APOL1 and EC/G2APOL1 mice. Scale bar=20μm.
G. Relative transcript level of Icam1 and Vcam1 in WT and G2APOL1 ECs treated as (A); Gapdh was used for normalization. **p<0.01, ***p<0.001 vs WT; #p < 0.05, ###p < 0.001 vs. indicated group.
H. Relative transcript level of Icam1 and Vcam1 in WT and G2APOL1 ECs treated as (C); Gapdh was used for normalization. **p<0.01, ***p<0.001 vs WT; ##p < 0.01, ###p < 0.001 vs. indicated group.
I. Relative transcript level of Ifnb, Ifitm1, Stat1 and Isg15 in WT and G2APOL1 ECs treated as (A); **p<0.01, ***p<0.001 vs WT; #p < 0.05, ##p < 0.01, ###p < 0.001 vs. indicated group.
J. Relative transcript level of Ifnb, Ifitm1, Stat1 and Isg15 in WT and G2APOL1 ECs treated as (C); **p<0.01, ***p<0.001 vs WT; #p < 0.05, ##p < 0.01, ###p < 0.001 vs. indicated group.